Fig. 6.
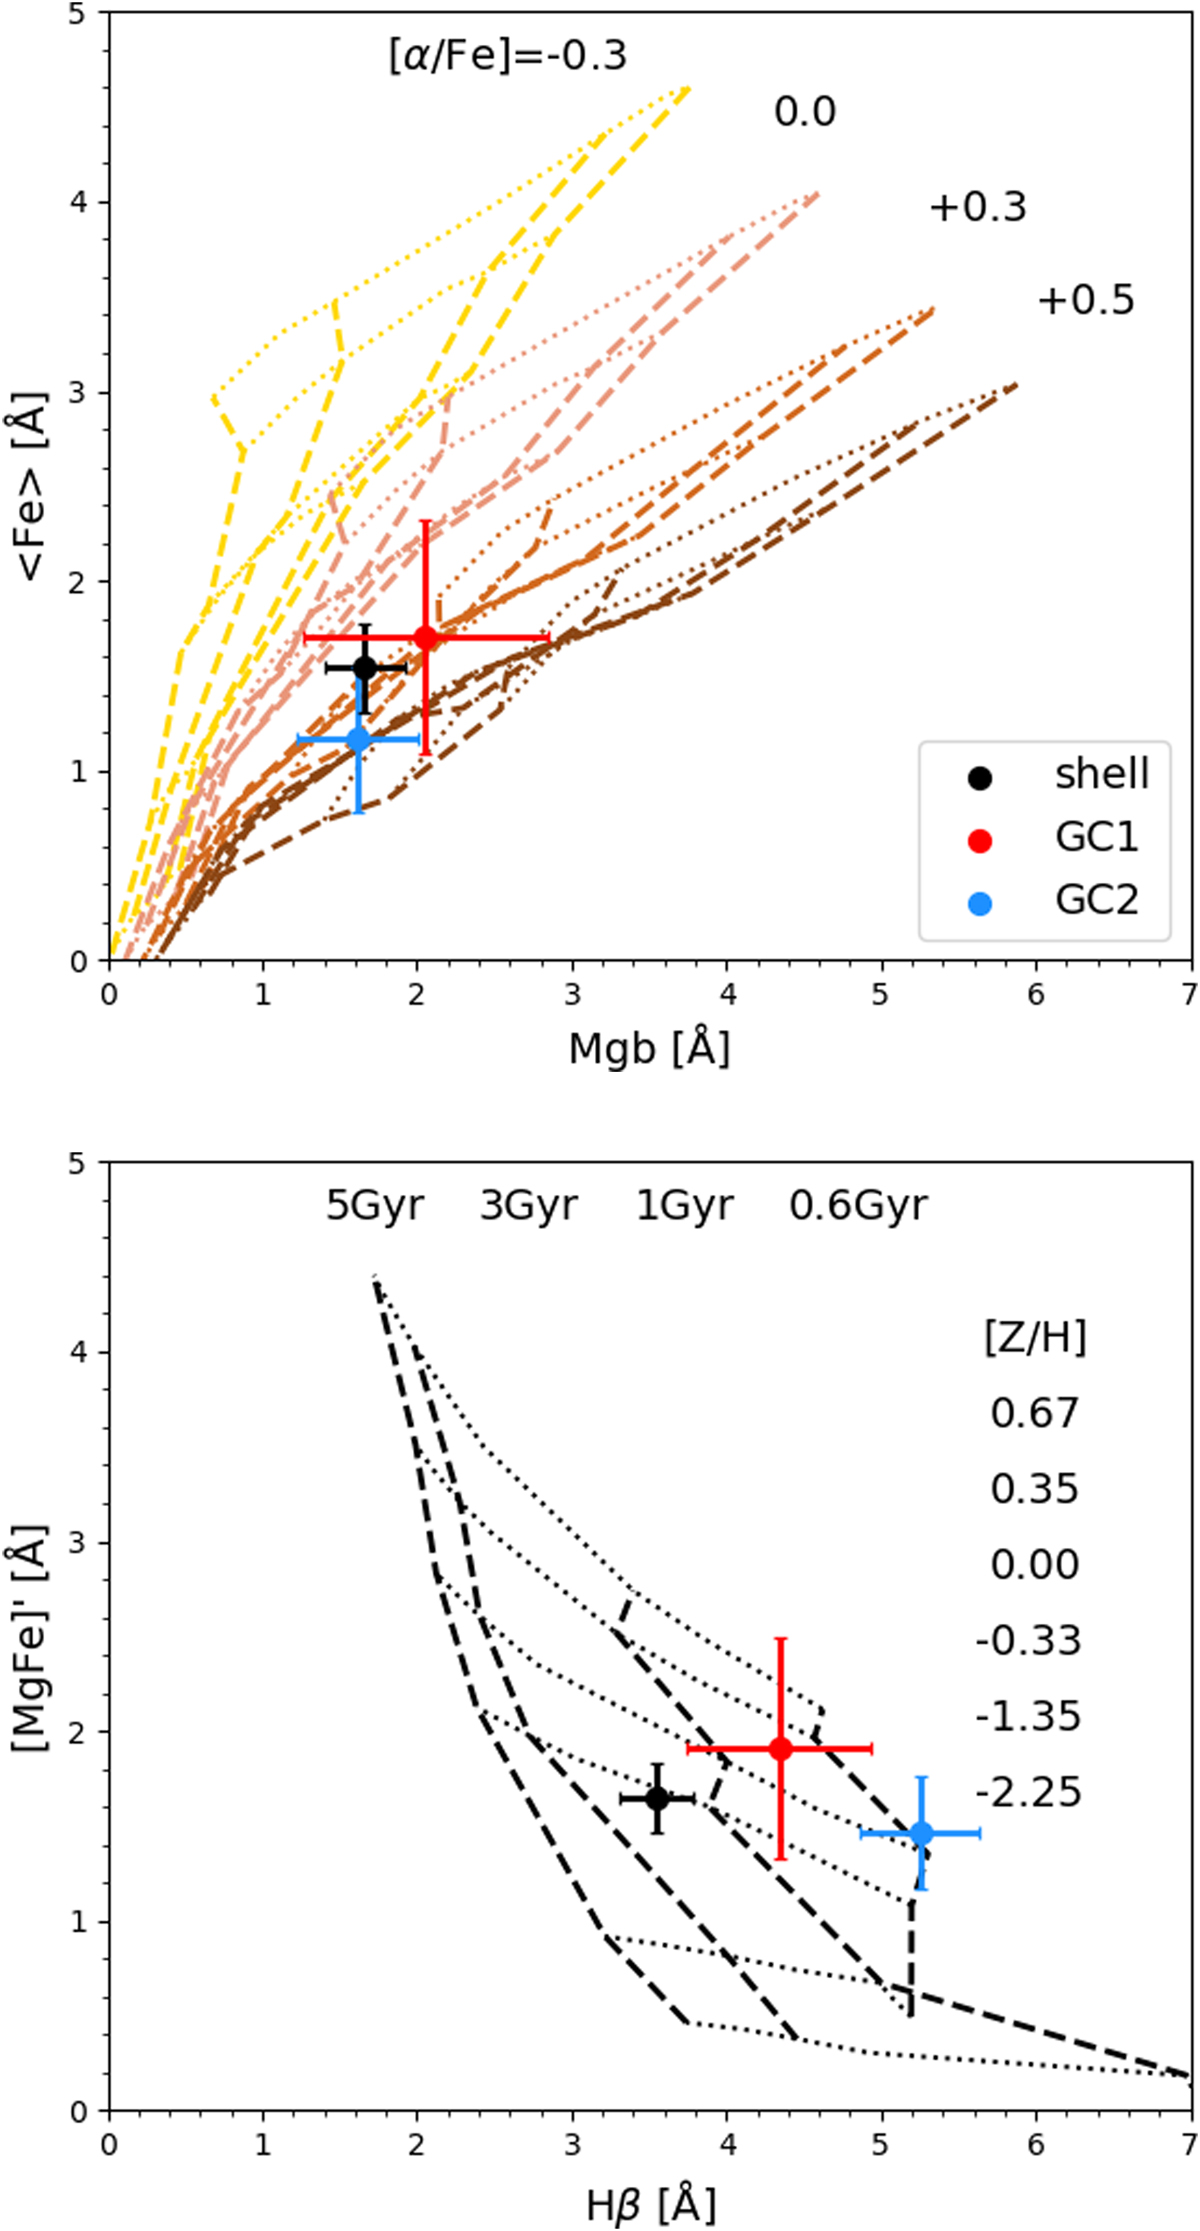
Lick/IDS indices measured from the MUSE spectra of the shell, GC1, and GC2. Definitions of the indices are given in the text. The model grids are from Thomas et al. (2010) with isochrones of 0.6, 1, 3, and 5 Gyr in dashed lines and iso-metallicities of −2.25, −1.35, −0.33, 0.0, 0.35, and 0.67 dex in dotted lines. Upper panel: grids are color-coded with respect to α-enrichment. The isochrones go from the leftmost (0.6 Gyr) to the rightmost one (5 Gyr). Lower panel: grid is shown for [α/Fe] = 0.3. The isochrones go from the rightmost (0.6 Gyr) to the leftmost one (5 Gyr), and iso-metallicities go from the lowest one (−2.32) to the highest one (0.67).
Current usage metrics show cumulative count of Article Views (full-text article views including HTML views, PDF and ePub downloads, according to the available data) and Abstracts Views on Vision4Press platform.
Data correspond to usage on the plateform after 2015. The current usage metrics is available 48-96 hours after online publication and is updated daily on week days.
Initial download of the metrics may take a while.