Open Access
Fig. 10.
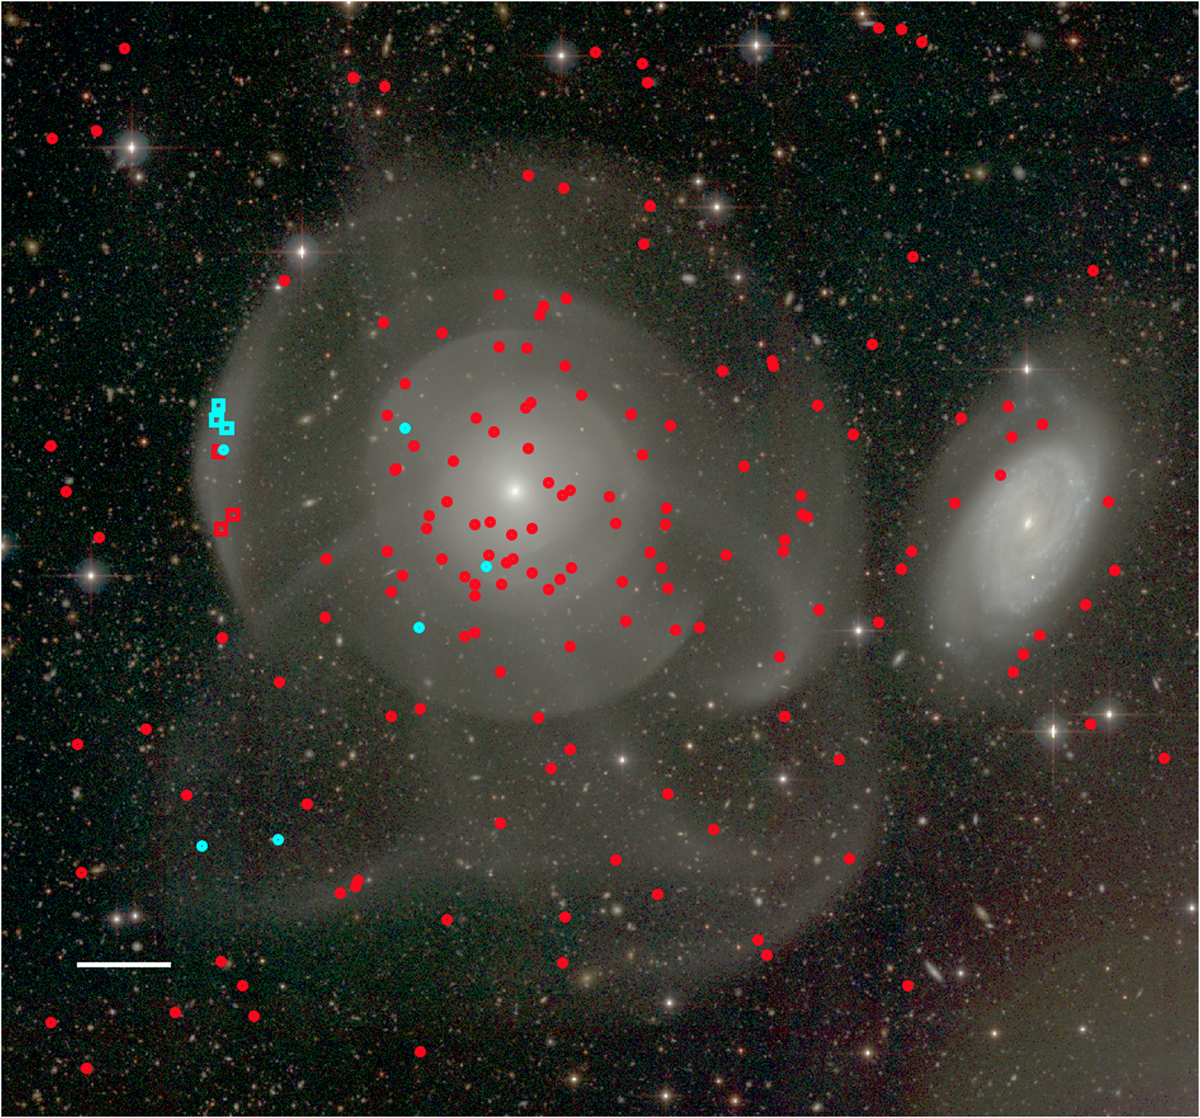
True-color image from Megacam at CFHT with locations of the GC candidates around NGC 474. Young candidates are shown in cyan, old candidates in red. The GC candidates for which we have MUSE spectroscopy are shown with squares. The white line spans 1 arcmin.
Current usage metrics show cumulative count of Article Views (full-text article views including HTML views, PDF and ePub downloads, according to the available data) and Abstracts Views on Vision4Press platform.
Data correspond to usage on the plateform after 2015. The current usage metrics is available 48-96 hours after online publication and is updated daily on week days.
Initial download of the metrics may take a while.