Free Access
Fig. 3.
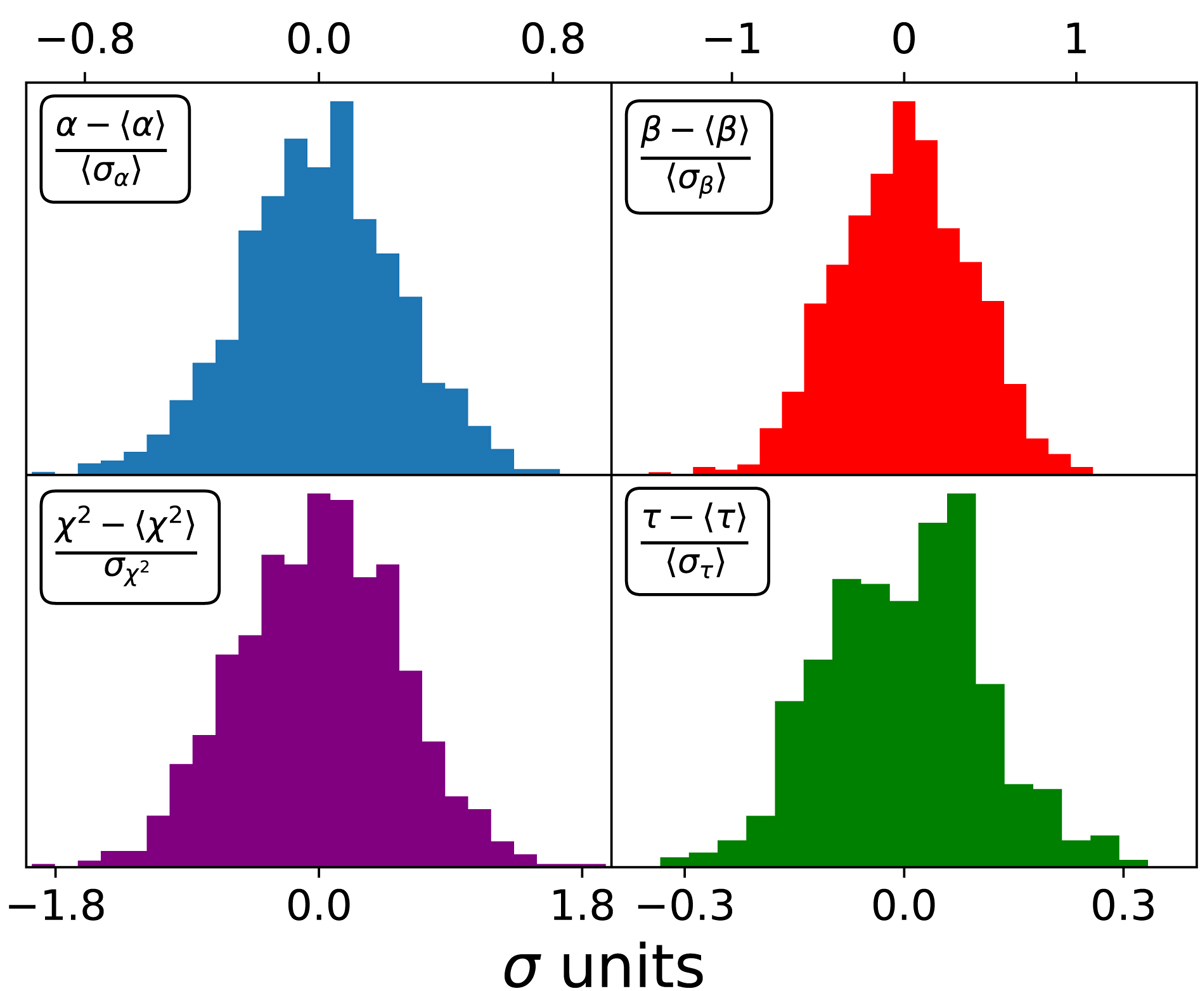
Histograms of the expected scatter in the recovered foreground scalings, in the χ2 of the component separation and in the measured τ due to the regularization noise. For each quantity, we show the distance from the center of the empirical distribution in units of σ.
Current usage metrics show cumulative count of Article Views (full-text article views including HTML views, PDF and ePub downloads, according to the available data) and Abstracts Views on Vision4Press platform.
Data correspond to usage on the plateform after 2015. The current usage metrics is available 48-96 hours after online publication and is updated daily on week days.
Initial download of the metrics may take a while.