Fig. 9
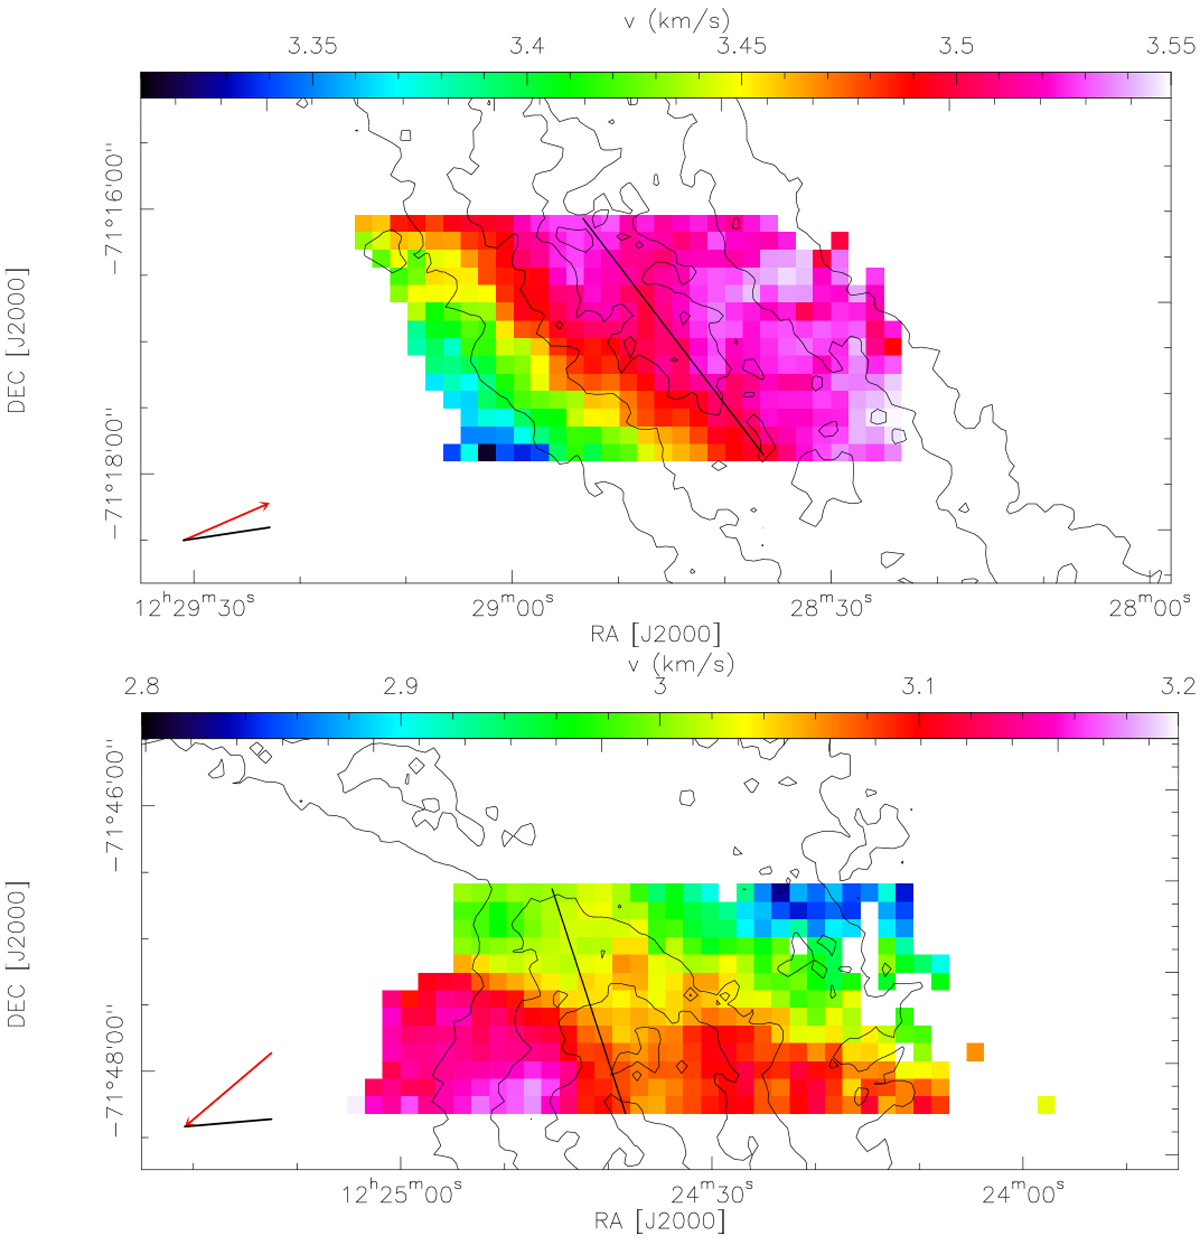
Velocity field obtained over the Musca filament crest from the C18O(2–1) line in the northern (top) and southern (bottom) map. The contours indicate the column density levels of the filament crest (![]() 3–6 × 10²¹
cm−3). The black line on the velocity field connects the maximal column density at the top and bottom of the map, indicating the local orientation of the filament axis. In the lower left corner, the red arrow indicates the orientation of the velocity gradient, while the black line indicates the orientation of the magnetic field.
3–6 × 10²¹
cm−3). The black line on the velocity field connects the maximal column density at the top and bottom of the map, indicating the local orientation of the filament axis. In the lower left corner, the red arrow indicates the orientation of the velocity gradient, while the black line indicates the orientation of the magnetic field.
Current usage metrics show cumulative count of Article Views (full-text article views including HTML views, PDF and ePub downloads, according to the available data) and Abstracts Views on Vision4Press platform.
Data correspond to usage on the plateform after 2015. The current usage metrics is available 48-96 hours after online publication and is updated daily on week days.
Initial download of the metrics may take a while.