Fig. 7
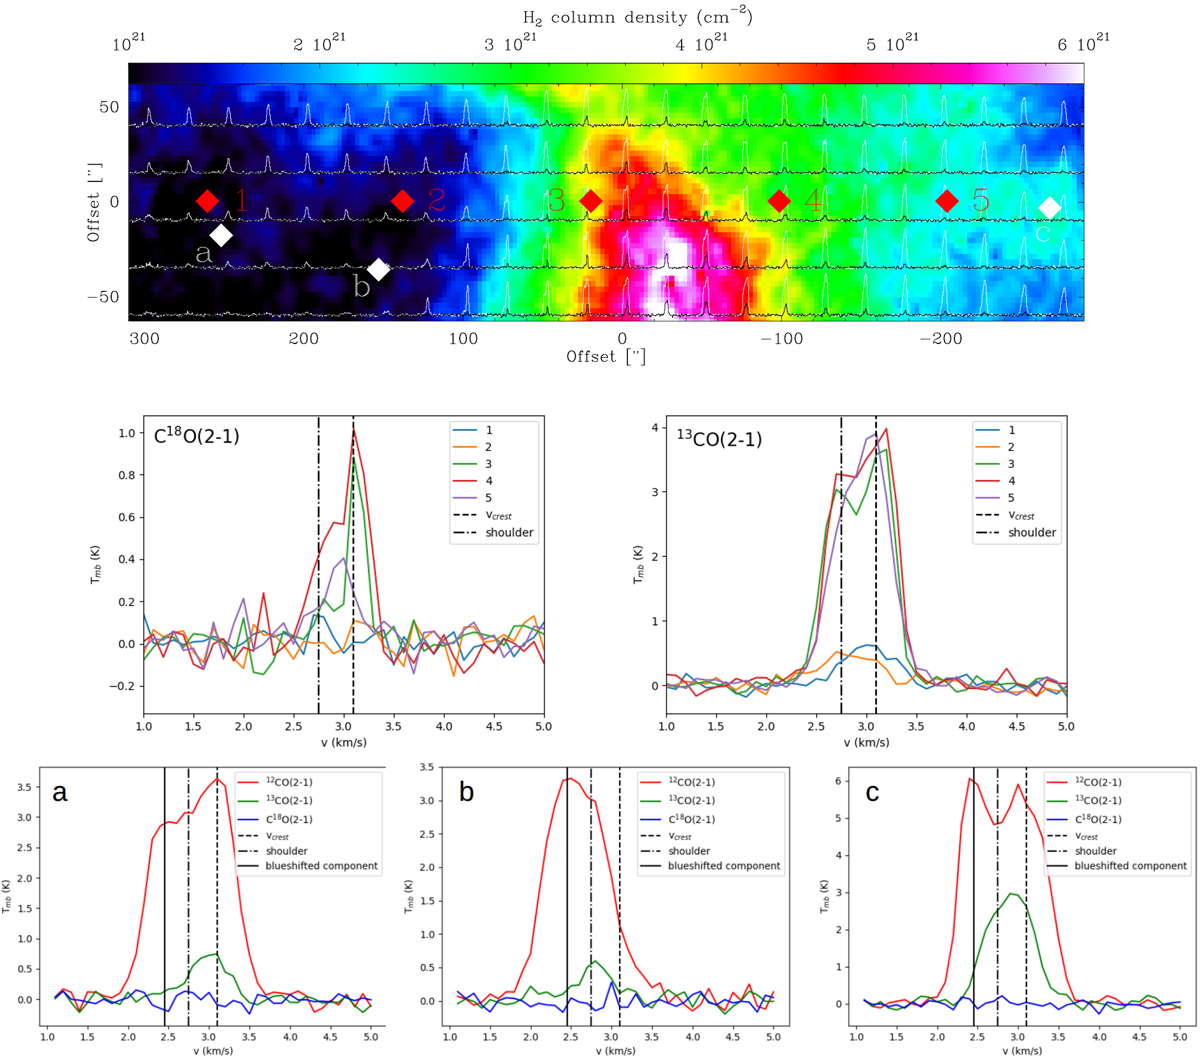
Top and middle: same as Fig. 6, but for the southern position, where the offset is centered on: α(2000) = 12h 24m46s and δ(2000) = –71°47′20′′. It can be noted that at the location where there are no strands (![]() 1.5 × 10²¹
cm−2) that the 13CO emission also disappears. Bottom:
12CO(2–1),
13CO(2–1) and C18O(2–1) emission at the indicated white positions (a, b, c) in the map above with the same beam size (28′′) and spectral resolution (0.1 km s−1). This indicates that in 12CO(2–1) there is an extra blueshifted component that is barely detected in 13CO(2–1). It also showsthat C18O(2–1) is not detected away from the filament crest with this data.
1.5 × 10²¹
cm−2) that the 13CO emission also disappears. Bottom:
12CO(2–1),
13CO(2–1) and C18O(2–1) emission at the indicated white positions (a, b, c) in the map above with the same beam size (28′′) and spectral resolution (0.1 km s−1). This indicates that in 12CO(2–1) there is an extra blueshifted component that is barely detected in 13CO(2–1). It also showsthat C18O(2–1) is not detected away from the filament crest with this data.
Current usage metrics show cumulative count of Article Views (full-text article views including HTML views, PDF and ePub downloads, according to the available data) and Abstracts Views on Vision4Press platform.
Data correspond to usage on the plateform after 2015. The current usage metrics is available 48-96 hours after online publication and is updated daily on week days.
Initial download of the metrics may take a while.