Fig. 6
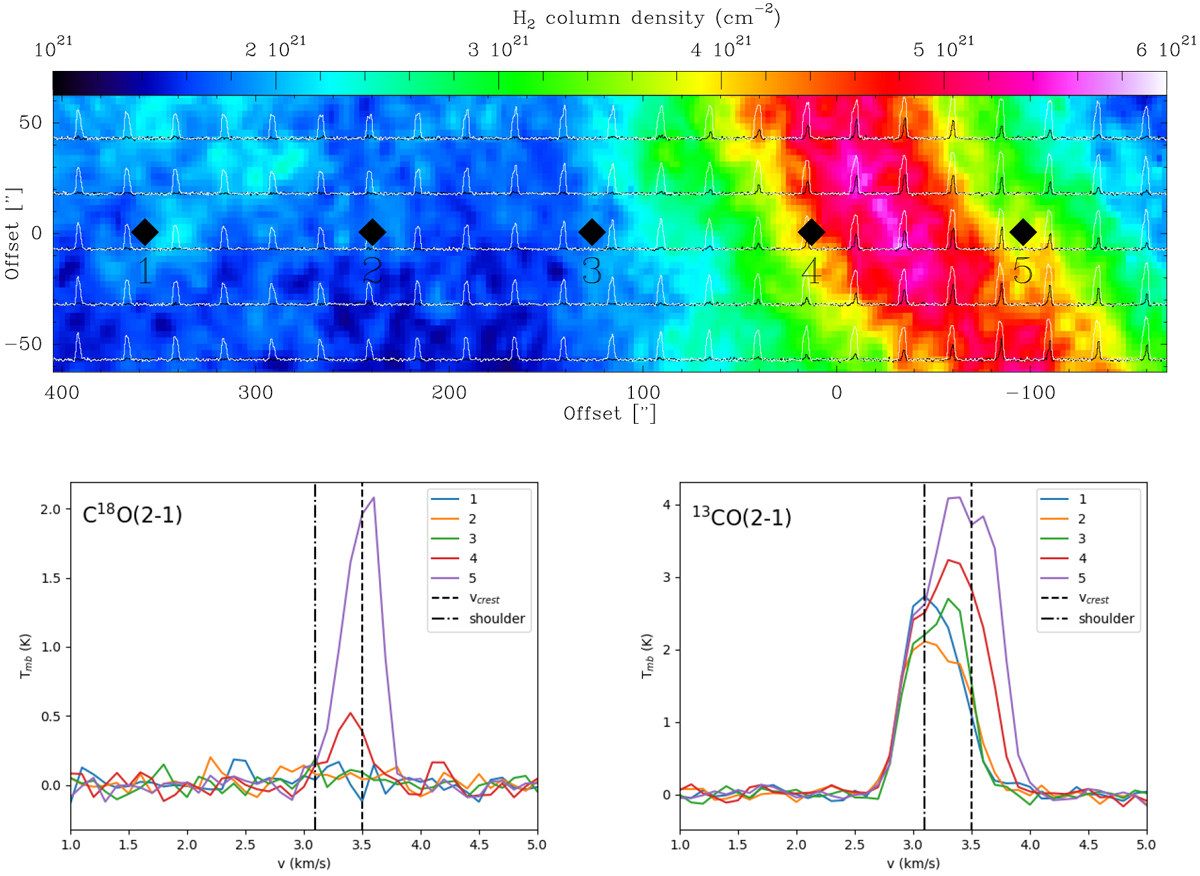
Top: 13CO(2–1) (in white) and C18O(2–1) (in black) spectra overlayed on the Herschel column density map of Musca (Cox et al. 2016) for the northern position. The offset is centred on: α(2000) = 12h 28m58s and δ(2000) = –71°16′55′′, and 100′′ corresponds to ~0.07 pc at a distance of 140 pc. C18O emission is only detected at the crest (green-yellow-red), while 13CO can be used to trace the strands (blue) as well. Bottom right: several 13CO(2–1) spectra are displayed that were extracted at the indicated positions in the map above. This shows that 13CO has two components towards the filament crest. Bottom left: same for C18O(2–1), demonstrating it is only detected towards the filament crest.
Current usage metrics show cumulative count of Article Views (full-text article views including HTML views, PDF and ePub downloads, according to the available data) and Abstracts Views on Vision4Press platform.
Data correspond to usage on the plateform after 2015. The current usage metrics is available 48-96 hours after online publication and is updated daily on week days.
Initial download of the metrics may take a while.