Fig. 5
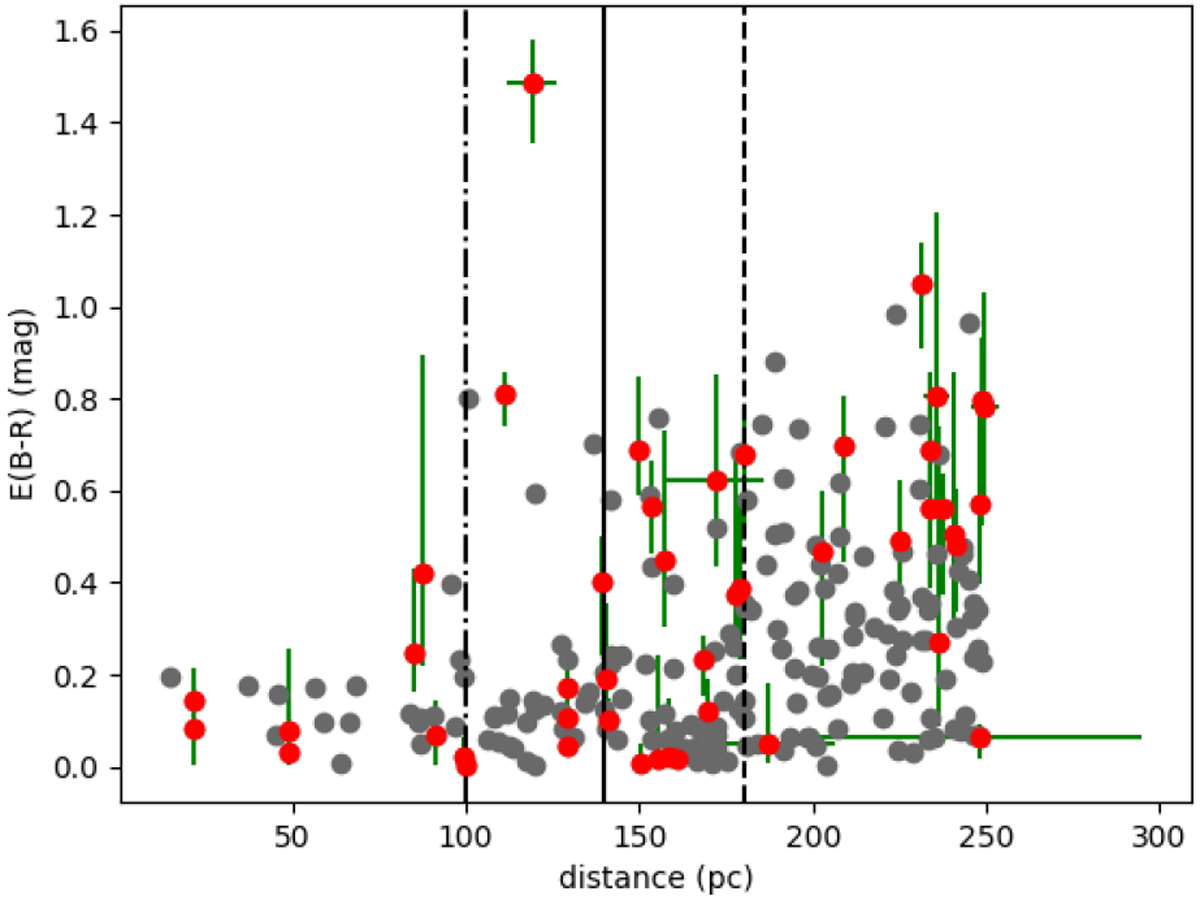
Reddening obtained with the Gaia telescope as a function of distance for stars in the region of the Musca cloud. The coloured points are observed at locations where the Planck 353 GHz emission is above the threshold that was used to define the area covered by the Musca cloud, see Appendix A. This shows a general increase of the reddening at a distance of 140 pc, shown with the full vertical line, but there also appears to be some reddening starting at 90–100 pc, indicated with the dashdot vertical line. The dashed vertical line indicates the distance of the Chamaeleon I, II and III molecular clouds at 183 pc from Zucker et al. (2019).
Current usage metrics show cumulative count of Article Views (full-text article views including HTML views, PDF and ePub downloads, according to the available data) and Abstracts Views on Vision4Press platform.
Data correspond to usage on the plateform after 2015. The current usage metrics is available 48-96 hours after online publication and is updated daily on week days.
Initial download of the metrics may take a while.