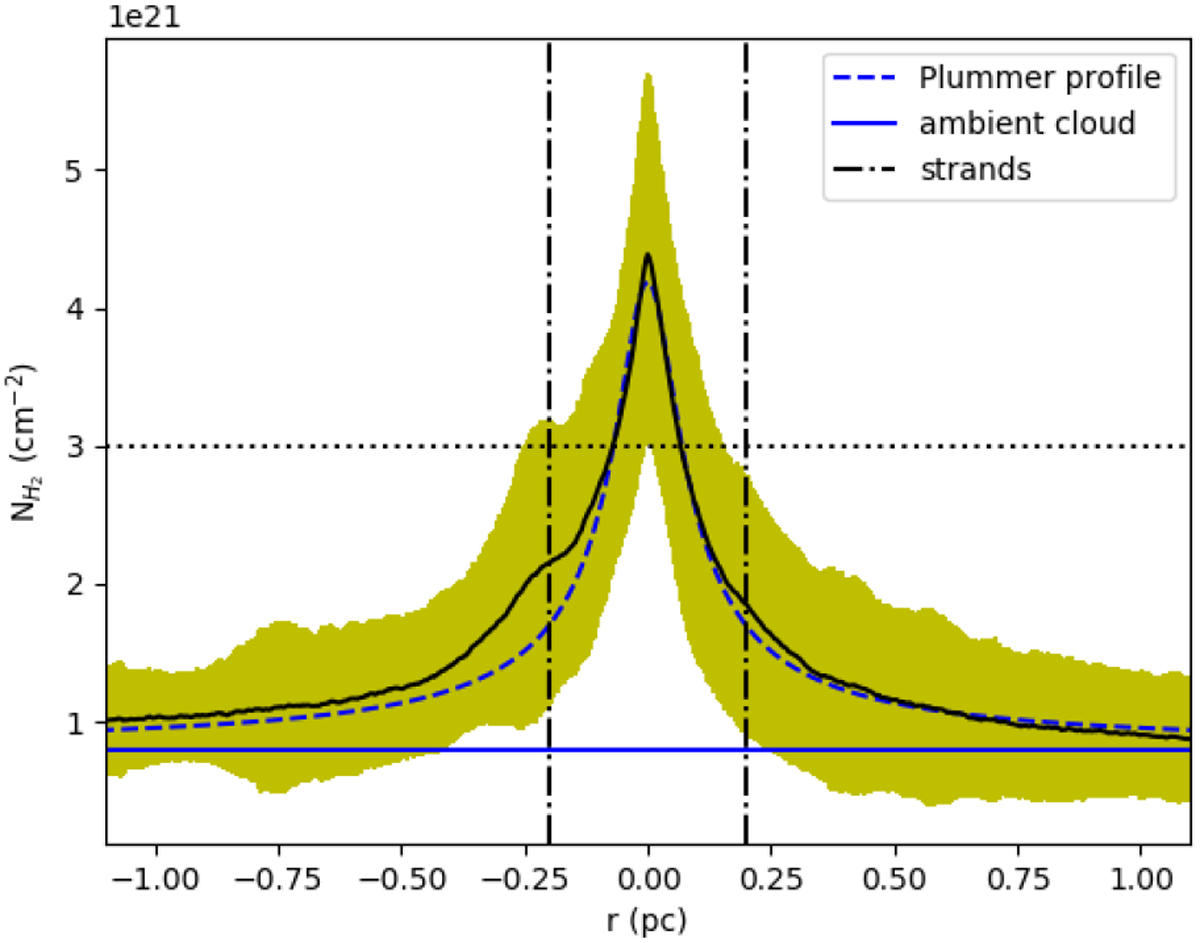
Fig. 3

Average column density profile of the Musca filament from the Herschel data (Cox et al. 2016), corrected to a distance of 140 pc. The blue horizontal line indicates the column density associated with the ambient cloud (![]() ~ 0.8 × 10²¹
cm−2). The dashed blue line shows the fitted Plummer profile to the column density (excluding the strands). The vertical lines indicate the location of column density excess with respect to the Plummer fit close to the filament crest, the so-called strands. The dashed horizontal black line indicates
~ 0.8 × 10²¹
cm−2). The dashed blue line shows the fitted Plummer profile to the column density (excluding the strands). The vertical lines indicate the location of column density excess with respect to the Plummer fit close to the filament crest, the so-called strands. The dashed horizontal black line indicates
![]() = 3 × 10²¹
cm−2, which is the minimal column density used to define the filament crest.
= 3 × 10²¹
cm−2, which is the minimal column density used to define the filament crest.
Current usage metrics show cumulative count of Article Views (full-text article views including HTML views, PDF and ePub downloads, according to the available data) and Abstracts Views on Vision4Press platform.
Data correspond to usage on the plateform after 2015. The current usage metrics is available 48-96 hours after online publication and is updated daily on week days.
Initial download of the metrics may take a while.


