Fig. A.1
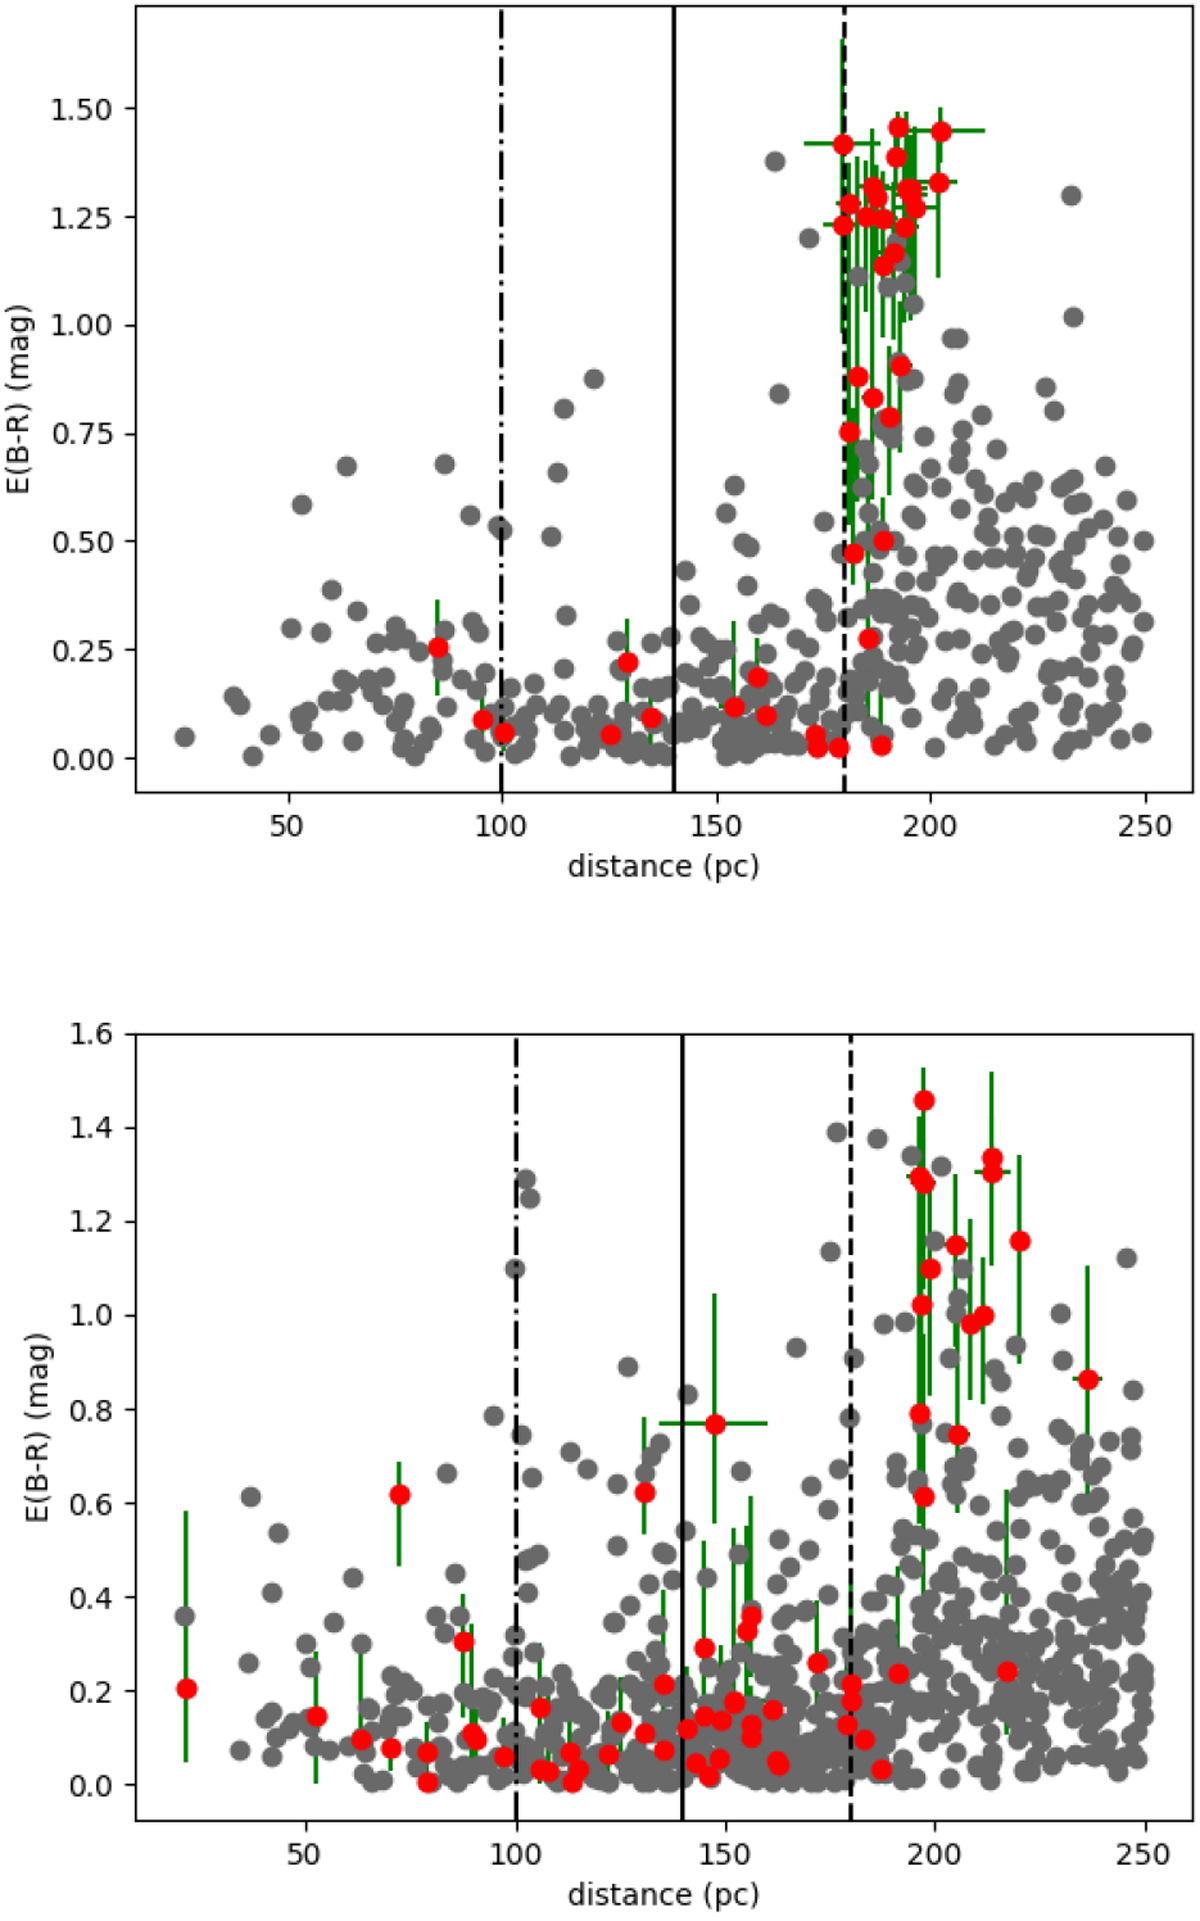
Top: reddening as a function of distance for stars in the area covered by Cha I. As in Fig. 5, the red points are located at the high density region of the cloud. This shows that the reddening experiences a strong jump around 180 pc as was found in Zucker et al. (2019). The other two vertical lines in the plots indicate a distance of 100 and 140 pc. Bottom: same for the region Cha II and Cha III together, showing a reddening jump at 190 pc.
Current usage metrics show cumulative count of Article Views (full-text article views including HTML views, PDF and ePub downloads, according to the available data) and Abstracts Views on Vision4Press platform.
Data correspond to usage on the plateform after 2015. The current usage metrics is available 48-96 hours after online publication and is updated daily on week days.
Initial download of the metrics may take a while.