Fig. 21
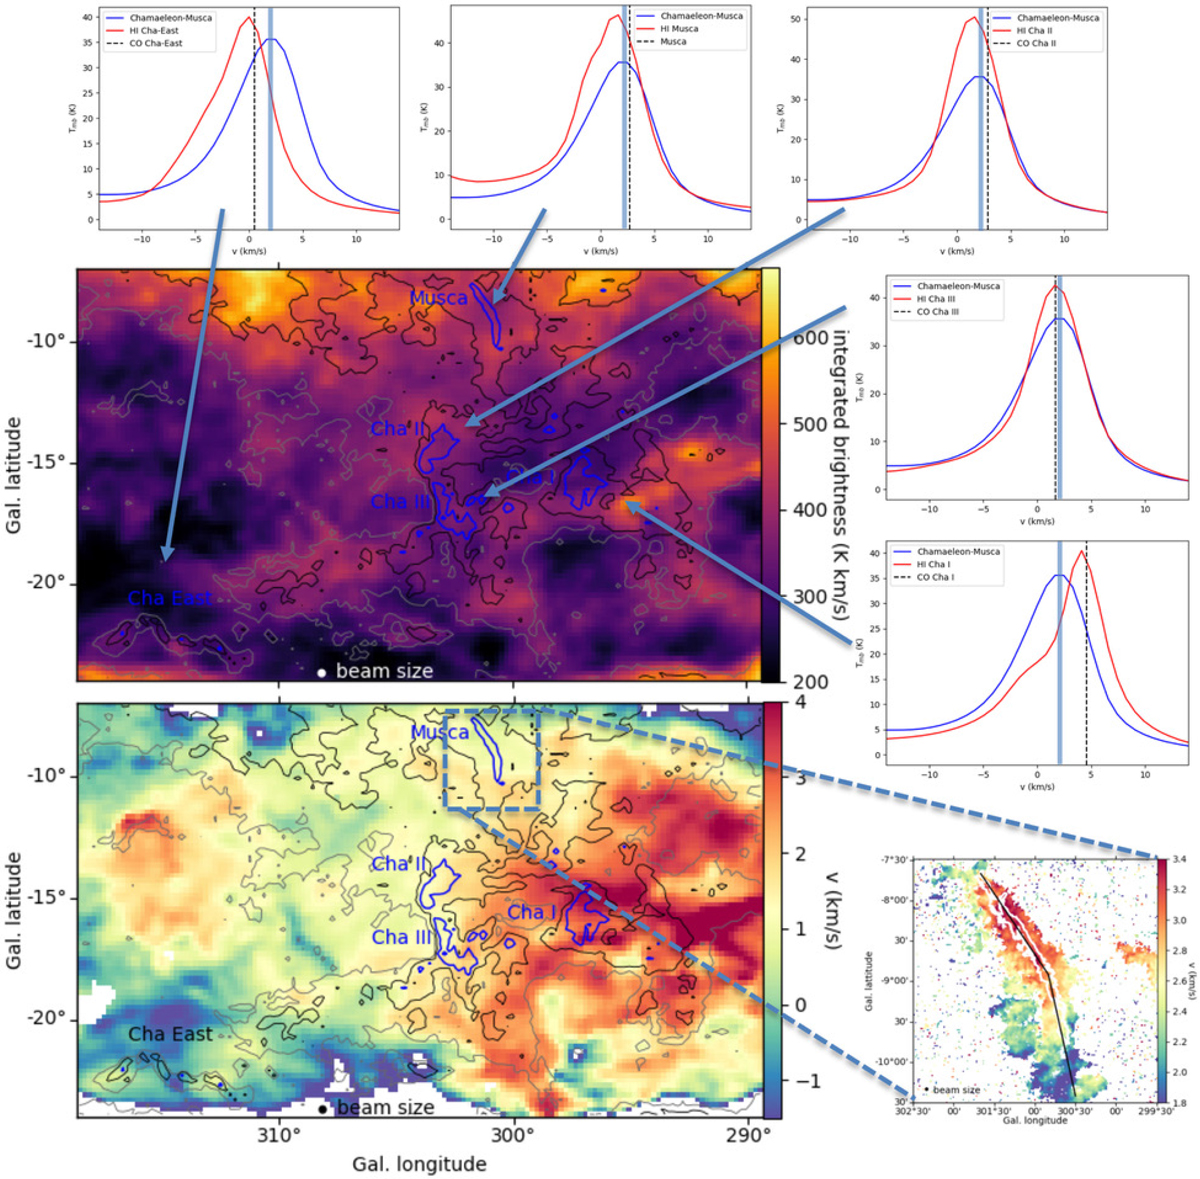
Integrated H I map (top) and the velocity field (below) of the Chamaeleon-Musca complex from fitting a single gaussian to the H I spectra, with overplotted Planck brightness contours at 353 GHz. The blue contours highlight the dense Chamaeleon molecular clouds and the Musca filament, while the black and grey contours indicate the more extended continuum emission from Planck. Around the two maps, the average H I spectrum of the full complex and its peak emission (blue) is compared with the local H I spectrum (red) and velocity of the CO gas (black dashed line) (Mizuno et al. 2001)from the selected dense region (Cha I, Cha II, Cha III, Cha East and Musca). In the lower right figure, the 12CO velocity field from the NANTEN2 data is shown.
Current usage metrics show cumulative count of Article Views (full-text article views including HTML views, PDF and ePub downloads, according to the available data) and Abstracts Views on Vision4Press platform.
Data correspond to usage on the plateform after 2015. The current usage metrics is available 48-96 hours after online publication and is updated daily on week days.
Initial download of the metrics may take a while.