Fig. 20
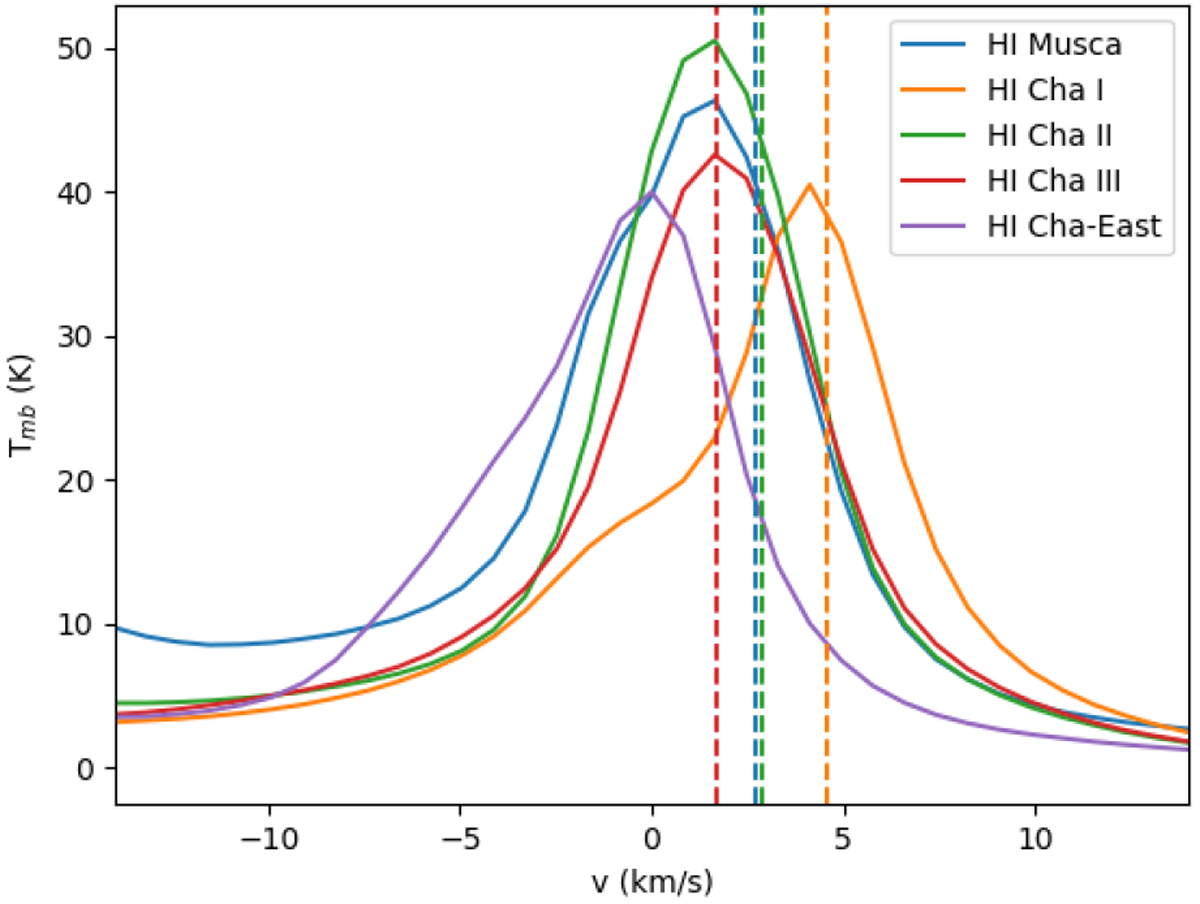
H I spectra averaged towards Cha I, Cha II, Cha III, the eastern region of the Chamaeleon cloud and Musca. The dashed vertical lines give the 12CO velocities of the dense regions Cha I, Cha II, Cha III and Musca (Mizuno et al. 2001). This shows that the dense gas traced by 12CO for all regions is redshifted compared to their H I emission, identical to what is found for the filament crest of Musca when comparing 12CO and C18O.
Current usage metrics show cumulative count of Article Views (full-text article views including HTML views, PDF and ePub downloads, according to the available data) and Abstracts Views on Vision4Press platform.
Data correspond to usage on the plateform after 2015. The current usage metrics is available 48-96 hours after online publication and is updated daily on week days.
Initial download of the metrics may take a while.