Fig. 2
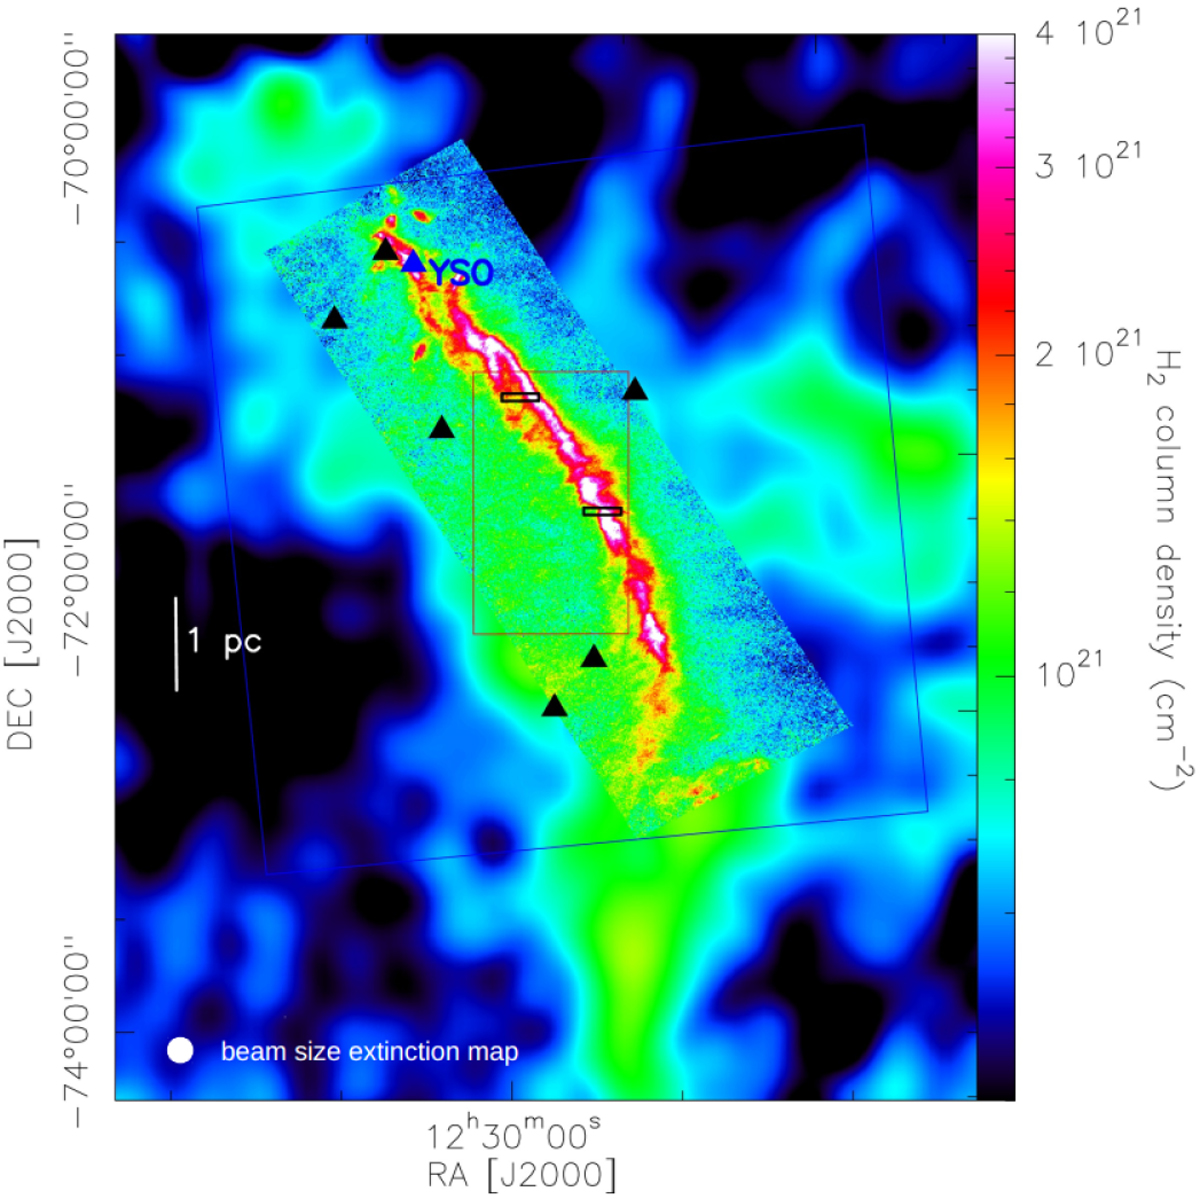
Column density map of the Musca filament from the HGBS (André et al. 2010; Cox et al. 2016) embedded in the large scale 2MASS extinction map of Musca, scaled to the Herschel column density, that traces the ambient cloud. The extinction map was produced by the AV mapping tool in Schneider et al. (2011). The black boxes indicate the maps made with the APEX telescope, the red box indicates the area displayed in Fig. 4, and the blue box indicates the area mapped with the NANTEN2 telescope. The black triangles show the locations of the stars with a distance smaller than 140 pc and a significant reddening (> 0.3) in the Gaia catalogue. The blue triangle shows the location of the only young stellar object (YSO) in the Musca filament.
Current usage metrics show cumulative count of Article Views (full-text article views including HTML views, PDF and ePub downloads, according to the available data) and Abstracts Views on Vision4Press platform.
Data correspond to usage on the plateform after 2015. The current usage metrics is available 48-96 hours after online publication and is updated daily on week days.
Initial download of the metrics may take a while.