Fig. 16
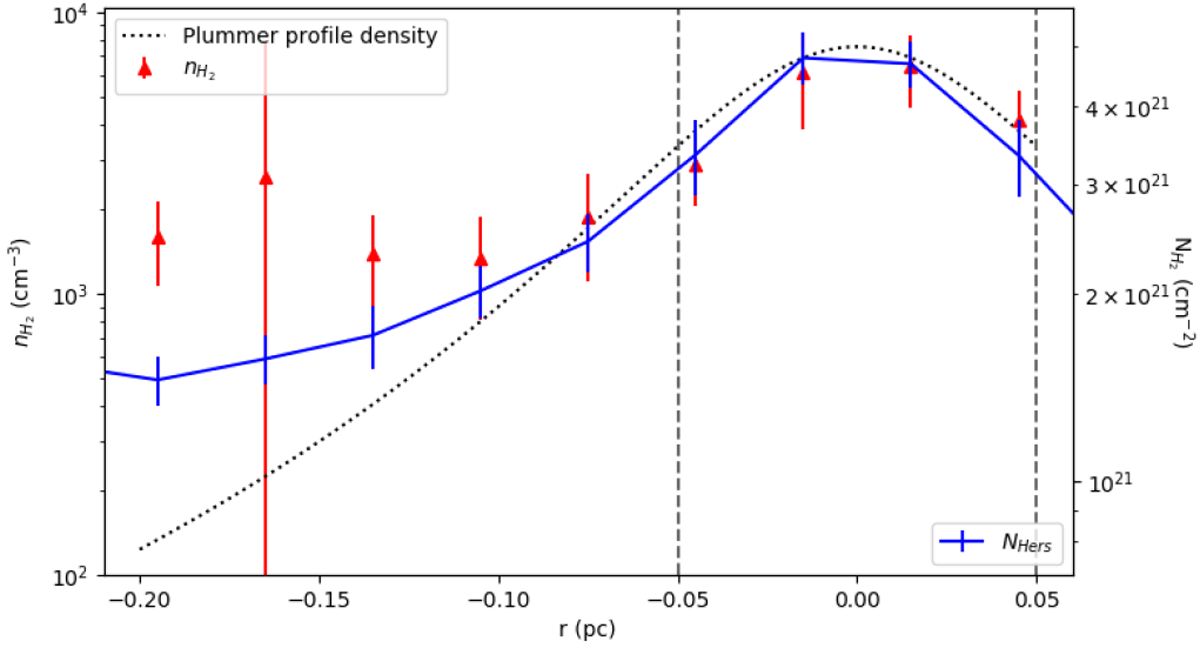
Density profile and its standard deviation obtained from the 13CO(3–2)/13CO(2–1) ratio as a function of the distance from the filament crest for the northern map (in red). The vertical dashed lines indicate the extent of the filament crest. It should be noted that the Herschel temperature is too high for the filament crest such that the density will be slightly higher than the values shown in this figure, see Fig. 15. The dotted blackline describes the Plummer density profile for the Musca filament as derived from the column density profile using Eq. (1) in Arzoumanian et al. (2011). This density profile fits with density predictions at the filament crest, but towards the strands the density is significantly higher than predicted from the Plummer profile. The Herschel column density profile, in blue, is plotted on the axis on the right. When comparing the density profile with the column density profile, one should take into account the different scales of the left and right axes.
Current usage metrics show cumulative count of Article Views (full-text article views including HTML views, PDF and ePub downloads, according to the available data) and Abstracts Views on Vision4Press platform.
Data correspond to usage on the plateform after 2015. The current usage metrics is available 48-96 hours after online publication and is updated daily on week days.
Initial download of the metrics may take a while.