Fig. 15
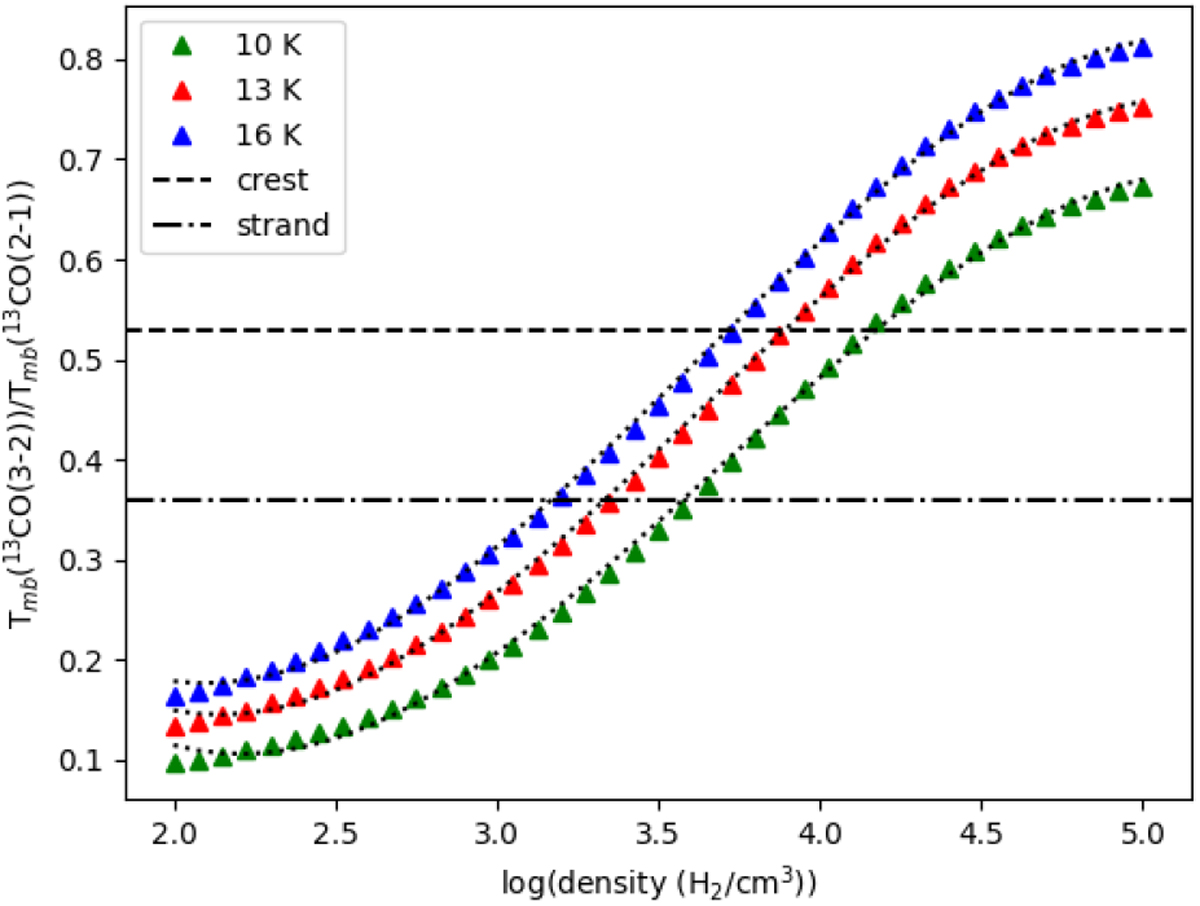
Evolution of the 13CO(3–2)/13CO(2–1) brightness temperature ratio as a function of density for realistic temperatures of the Musca filament. The dotted curves are the functions fitted through the RADEX results to invert the observed ratio in Musca to a density. The horizontal lines indicate the average observed ratios for the strand and the crest in the northern map.
Current usage metrics show cumulative count of Article Views (full-text article views including HTML views, PDF and ePub downloads, according to the available data) and Abstracts Views on Vision4Press platform.
Data correspond to usage on the plateform after 2015. The current usage metrics is available 48-96 hours after online publication and is updated daily on week days.
Initial download of the metrics may take a while.