Fig. 14
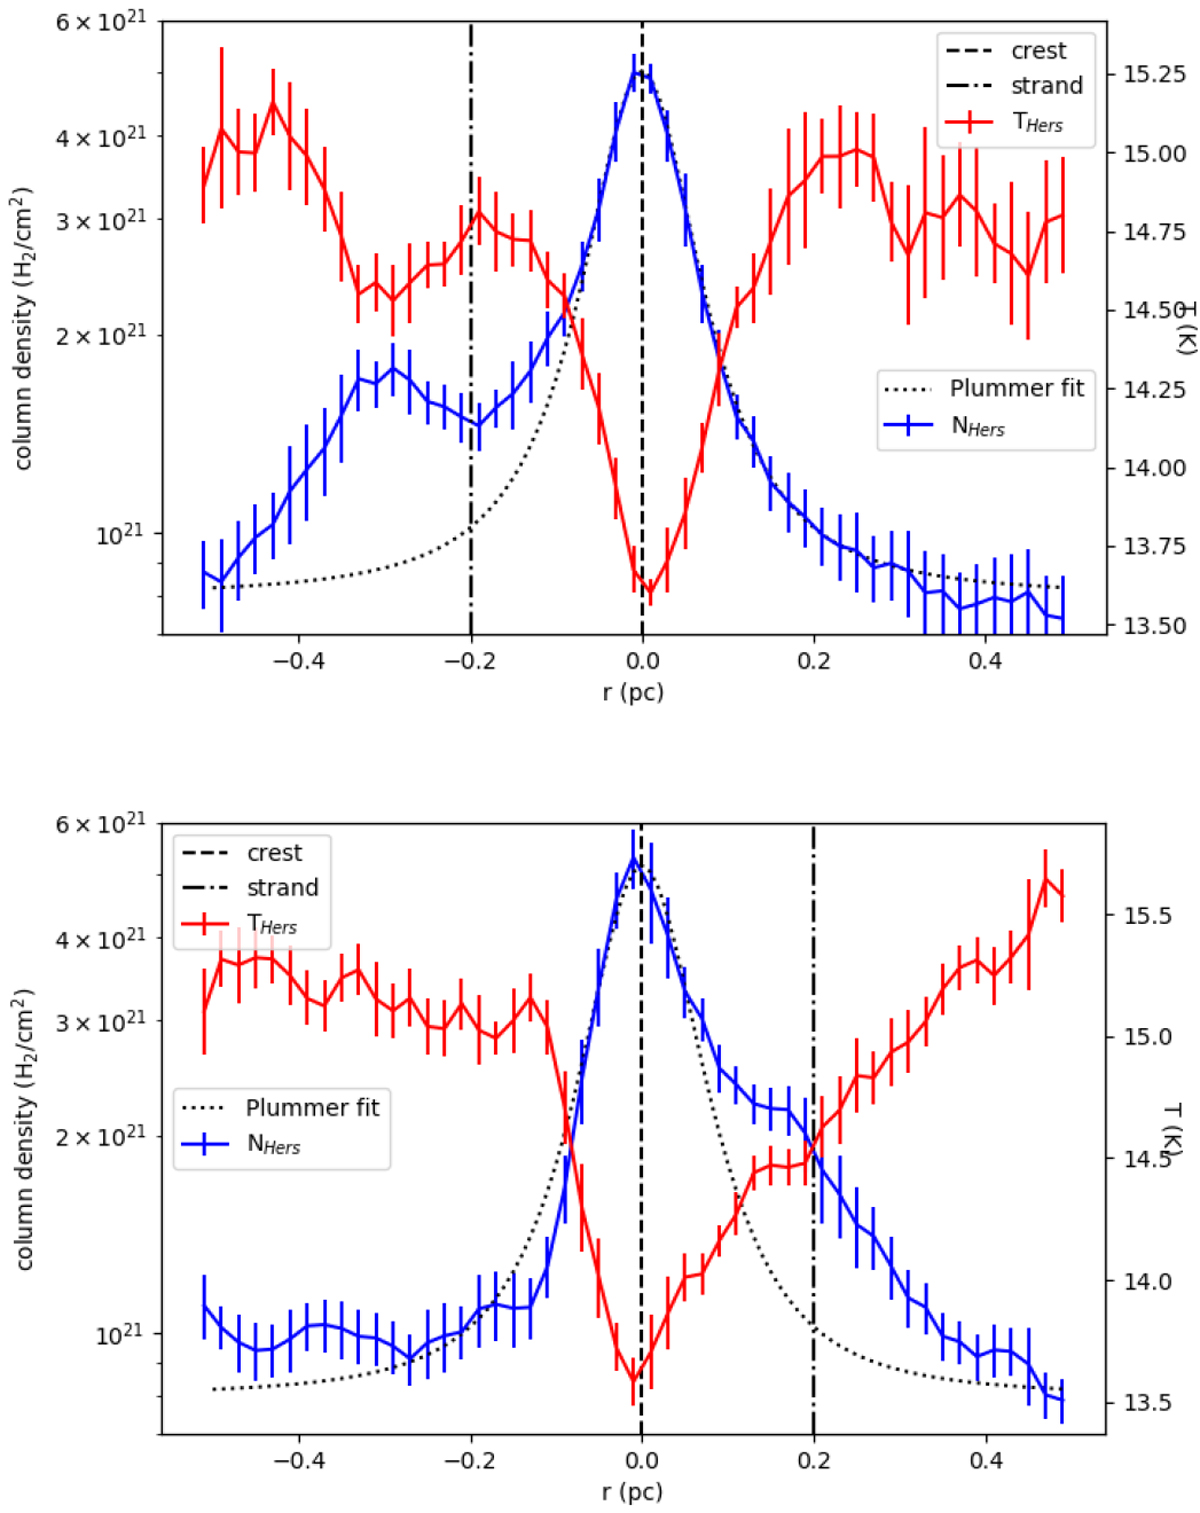
Top:Herschel column density and temperature profile in the northern map. It demonstrates an asymmetry of the column density due to the strands. The fitted Plummer profile (excluding the strands) shows that the strand is a dense structure directly next to the filament crest. The standard deviation from the average value is also indicated at each radius. A negative radius was chosen to be located east of the filament crest. Bottom: same for the southern map, note that the strand has changed side.
Current usage metrics show cumulative count of Article Views (full-text article views including HTML views, PDF and ePub downloads, according to the available data) and Abstracts Views on Vision4Press platform.
Data correspond to usage on the plateform after 2015. The current usage metrics is available 48-96 hours after online publication and is updated daily on week days.
Initial download of the metrics may take a while.