Fig. 13
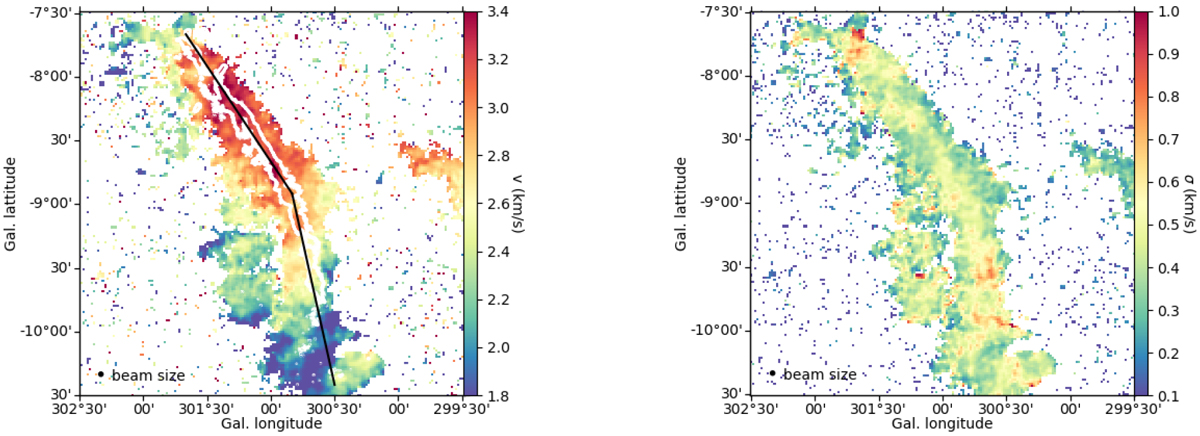
Left: 12CO(1–0) velocity field in the Musca cloud from fitting a single gaussian to the 12CO(1–0) NANTEN2 data, showing an organised velocity field along the Musca filament. The black line indicates the central axis used to construct the PV diagram in Fig. 23
perpendicular to the Musca filament. The white contours show the high column density region (![]() 2 × 1021 cm−2) in Musca. Right: 12CO(1–0) linewidth from the Gaussian fitting to the NANTEN2 data.
2 × 1021 cm−2) in Musca. Right: 12CO(1–0) linewidth from the Gaussian fitting to the NANTEN2 data.
Current usage metrics show cumulative count of Article Views (full-text article views including HTML views, PDF and ePub downloads, according to the available data) and Abstracts Views on Vision4Press platform.
Data correspond to usage on the plateform after 2015. The current usage metrics is available 48-96 hours after online publication and is updated daily on week days.
Initial download of the metrics may take a while.