Fig. 12
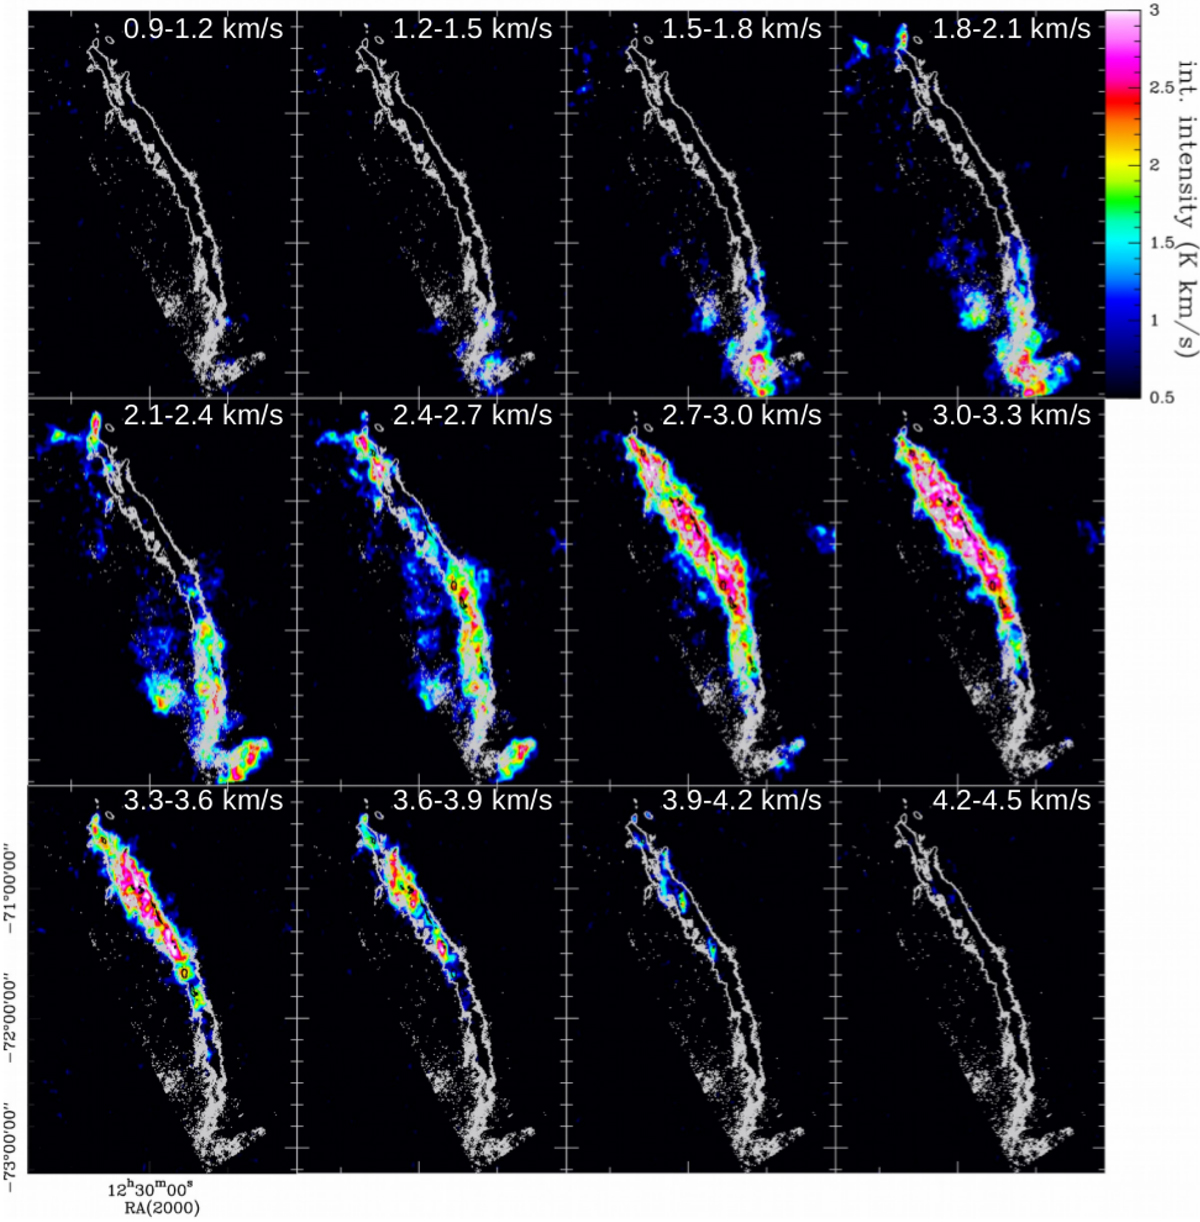
Integrated intensity of NANTEN2 data over velocity intervals of 0.3 km s−1. The black contours at ![]() = 5 × 1021 cm−2 from the Herschel data indicate the center of the filemant crest. These black contours are best visible at velocities between 2.7 and 3.6 km s−1 when there is 12CO(1–0) emission towards the crest. The grey contour, at
= 5 × 1021 cm−2 from the Herschel data indicate the center of the filemant crest. These black contours are best visible at velocities between 2.7 and 3.6 km s−1 when there is 12CO(1–0) emission towards the crest. The grey contour, at ![]() = 2 × 10²¹
cm−2, indicates the area that encloses the strands. It can be observed that there is some extended emission east of the Musca filament and that the filament crest is not at the middle of the area containing the strands.
= 2 × 10²¹
cm−2, indicates the area that encloses the strands. It can be observed that there is some extended emission east of the Musca filament and that the filament crest is not at the middle of the area containing the strands.
Current usage metrics show cumulative count of Article Views (full-text article views including HTML views, PDF and ePub downloads, according to the available data) and Abstracts Views on Vision4Press platform.
Data correspond to usage on the plateform after 2015. The current usage metrics is available 48-96 hours after online publication and is updated daily on week days.
Initial download of the metrics may take a while.