Fig. 11
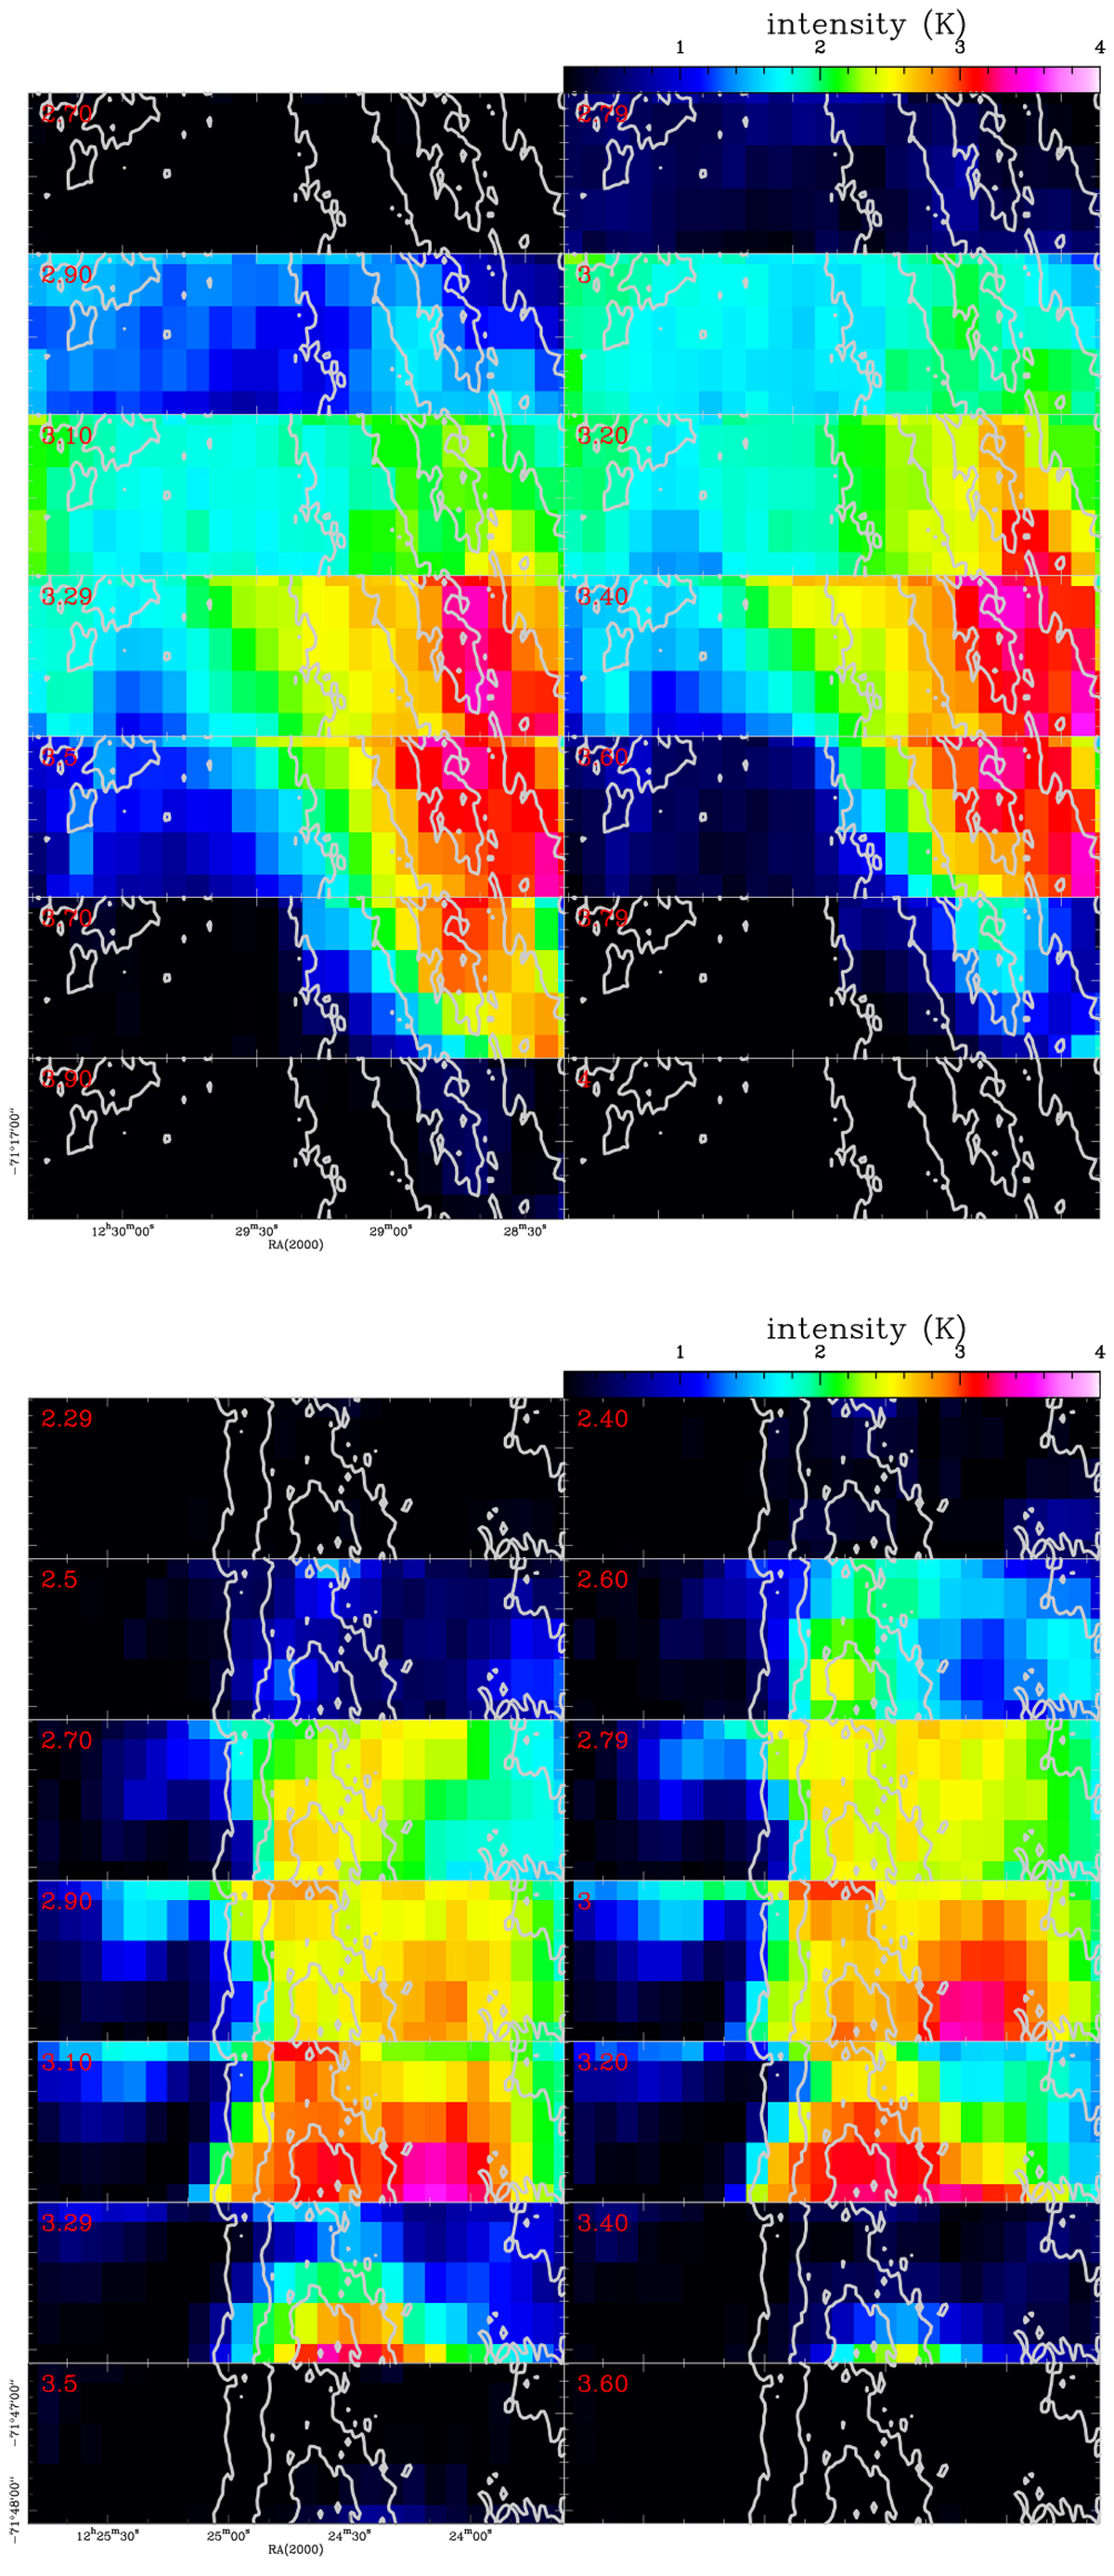
Top: channel maps of the APEX 13CO(2–1) observations in the northern map. The contours indicate the Herschel column densities
![]() = 2 × 10²¹, 3.5 × 10²¹ and 5 × 1021 cm−2. The velocityof the channel is indicated in red at the upper left corner of every channel. It can be seen that the velocities of the blueshifted shoulder trace the strands. Bottom: same for the southern map.
= 2 × 10²¹, 3.5 × 10²¹ and 5 × 1021 cm−2. The velocityof the channel is indicated in red at the upper left corner of every channel. It can be seen that the velocities of the blueshifted shoulder trace the strands. Bottom: same for the southern map.
Current usage metrics show cumulative count of Article Views (full-text article views including HTML views, PDF and ePub downloads, according to the available data) and Abstracts Views on Vision4Press platform.
Data correspond to usage on the plateform after 2015. The current usage metrics is available 48-96 hours after online publication and is updated daily on week days.
Initial download of the metrics may take a while.