Fig. 10
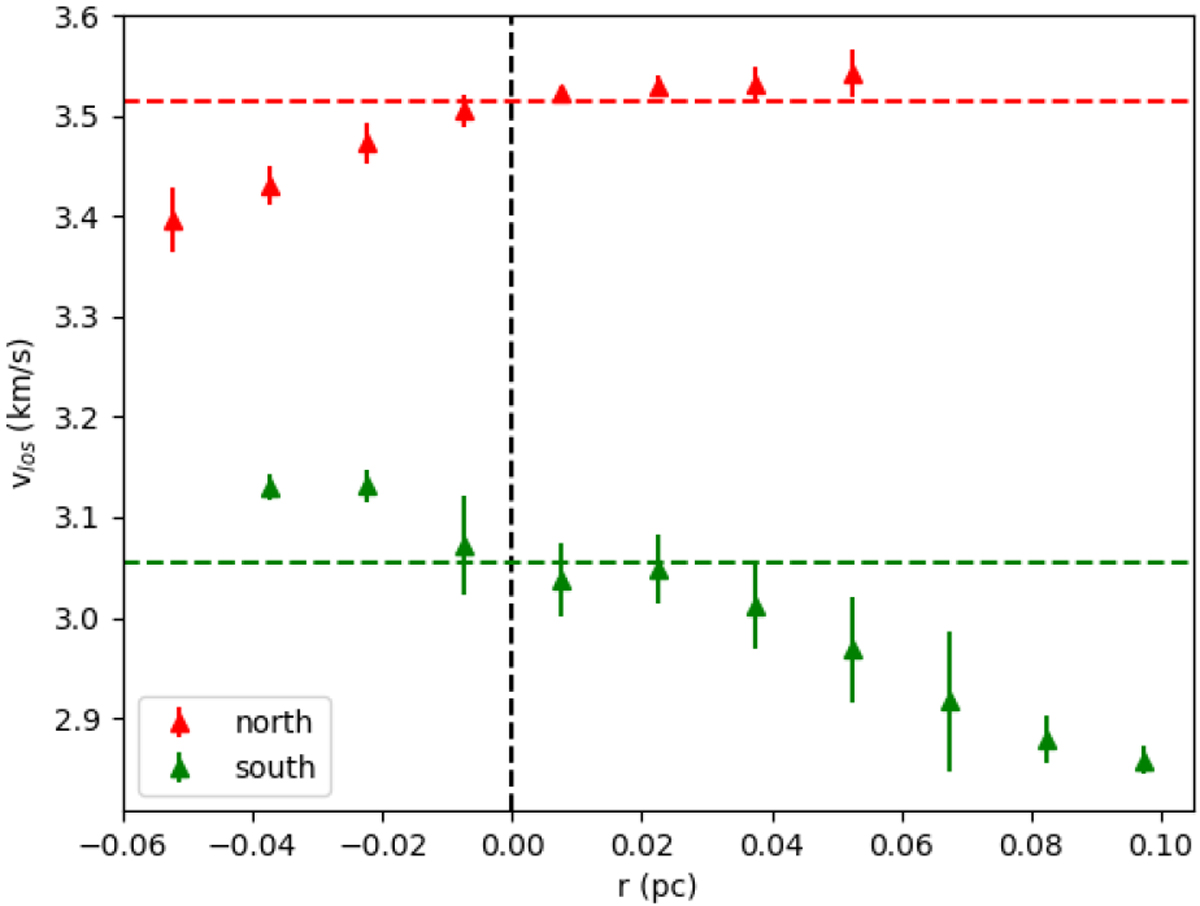
Line-of sight velocity across the filament derived from C18O(2–1) emission averaged along the filament as a function of the distance (r) for the northern (red) and southern (green) maps. The distance is always determined perpendicular to the local orientation of the filament crest center. The horizontal dashed lines indicate the velocity at the center of the filament crest, the vertical dashed line indicates the center of the crest, and the errorbars indicate the dispersion at each radius in the maps.
Current usage metrics show cumulative count of Article Views (full-text article views including HTML views, PDF and ePub downloads, according to the available data) and Abstracts Views on Vision4Press platform.
Data correspond to usage on the plateform after 2015. The current usage metrics is available 48-96 hours after online publication and is updated daily on week days.
Initial download of the metrics may take a while.