Fig. 1
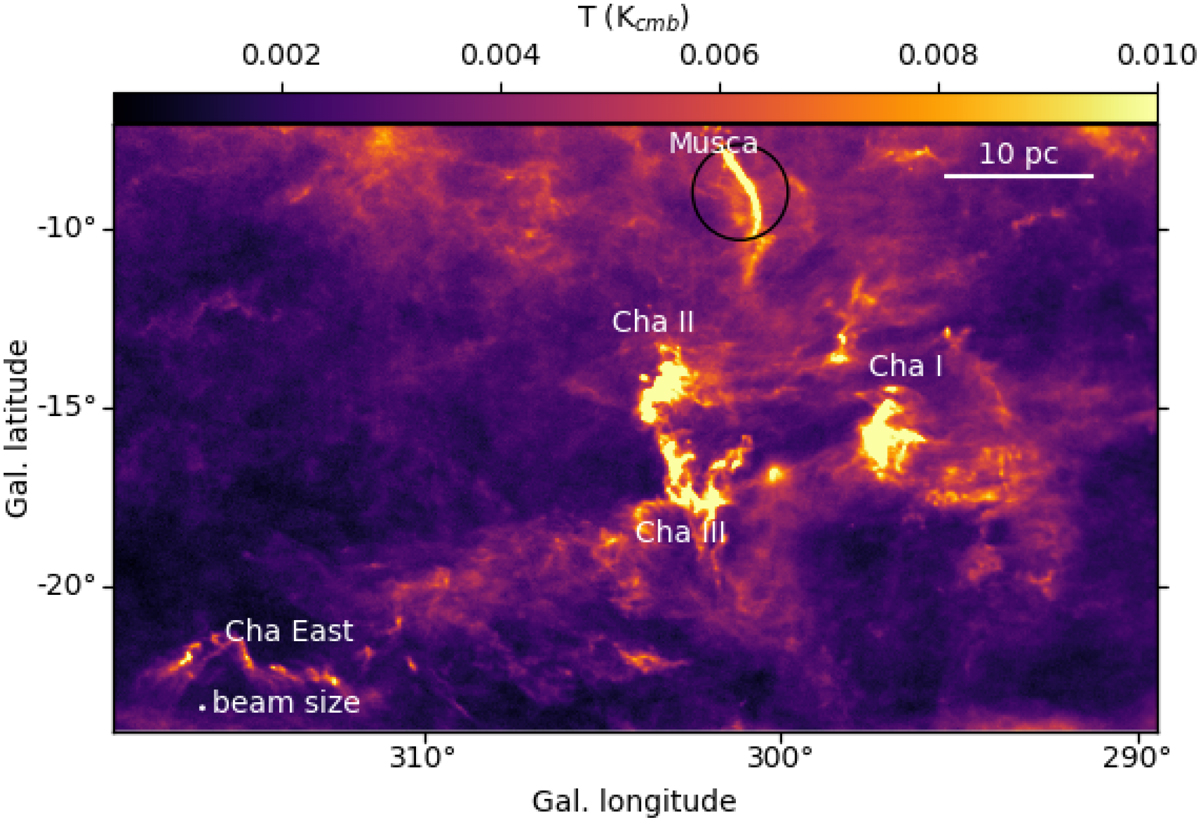
Planck emission map at 353 GHz of the Chamealeon-Musca complex (Planck Collaboration I 2016). The names of the relatively dense regions in the complex are indicated in white. The black circle indicates the region where Gaia data were extracted to investigate the distance of the Musca filament and cloud. The Planck resolution at 353 GHz is 4.8′, which corresponds to a physical size of 0.25 pc at a distance of 180 pc (Zucker et al. 2019).
Current usage metrics show cumulative count of Article Views (full-text article views including HTML views, PDF and ePub downloads, according to the available data) and Abstracts Views on Vision4Press platform.
Data correspond to usage on the plateform after 2015. The current usage metrics is available 48-96 hours after online publication and is updated daily on week days.
Initial download of the metrics may take a while.