Fig. 9.
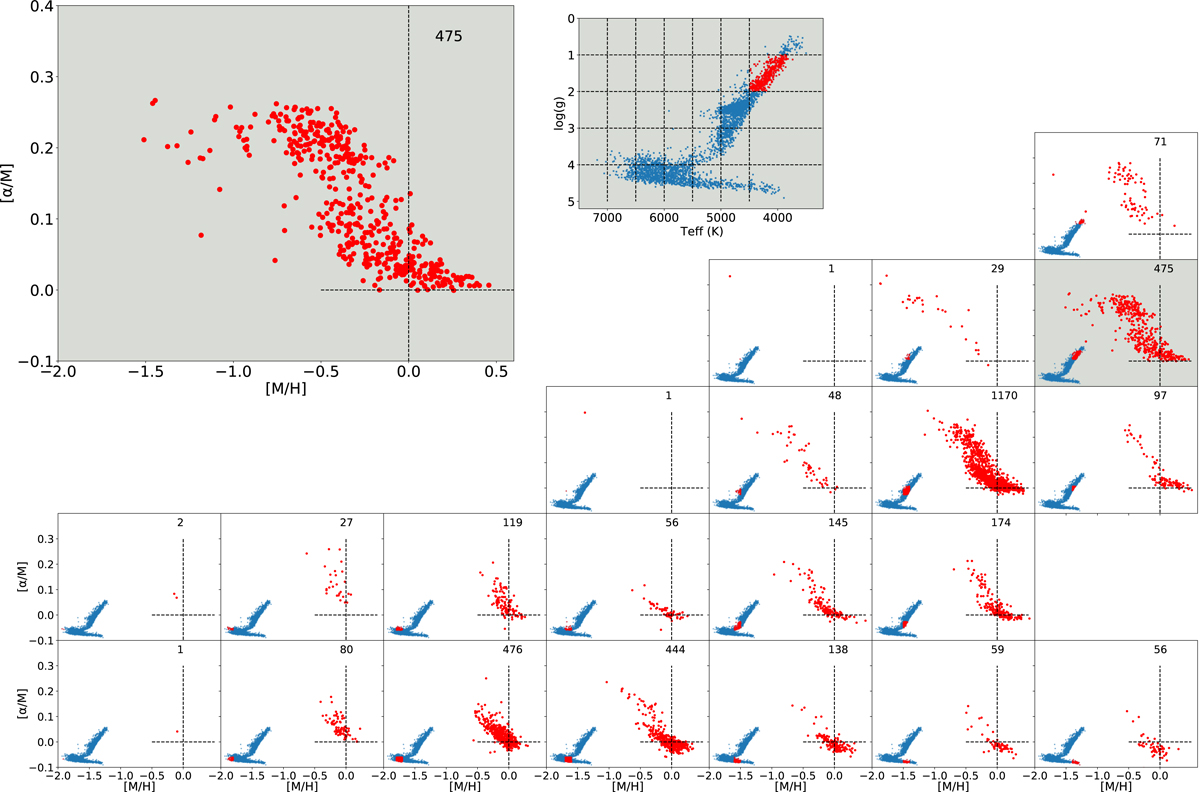
Averaged trained abundance patterns [α/M] vs. [M/H] for the training sample (red dots). Trends are shown for sub-samples in Teff (500 K bins) and log(g) (1 dex bins) shown as in-set Kiel diagrams, where the overall stellar distribution is plotted in blue with the selected subsample highlighted in red. The number of stars is indicated in the top right corner of each panel.
Current usage metrics show cumulative count of Article Views (full-text article views including HTML views, PDF and ePub downloads, according to the available data) and Abstracts Views on Vision4Press platform.
Data correspond to usage on the plateform after 2015. The current usage metrics is available 48-96 hours after online publication and is updated daily on week days.
Initial download of the metrics may take a while.