Free Access
Fig. 8.
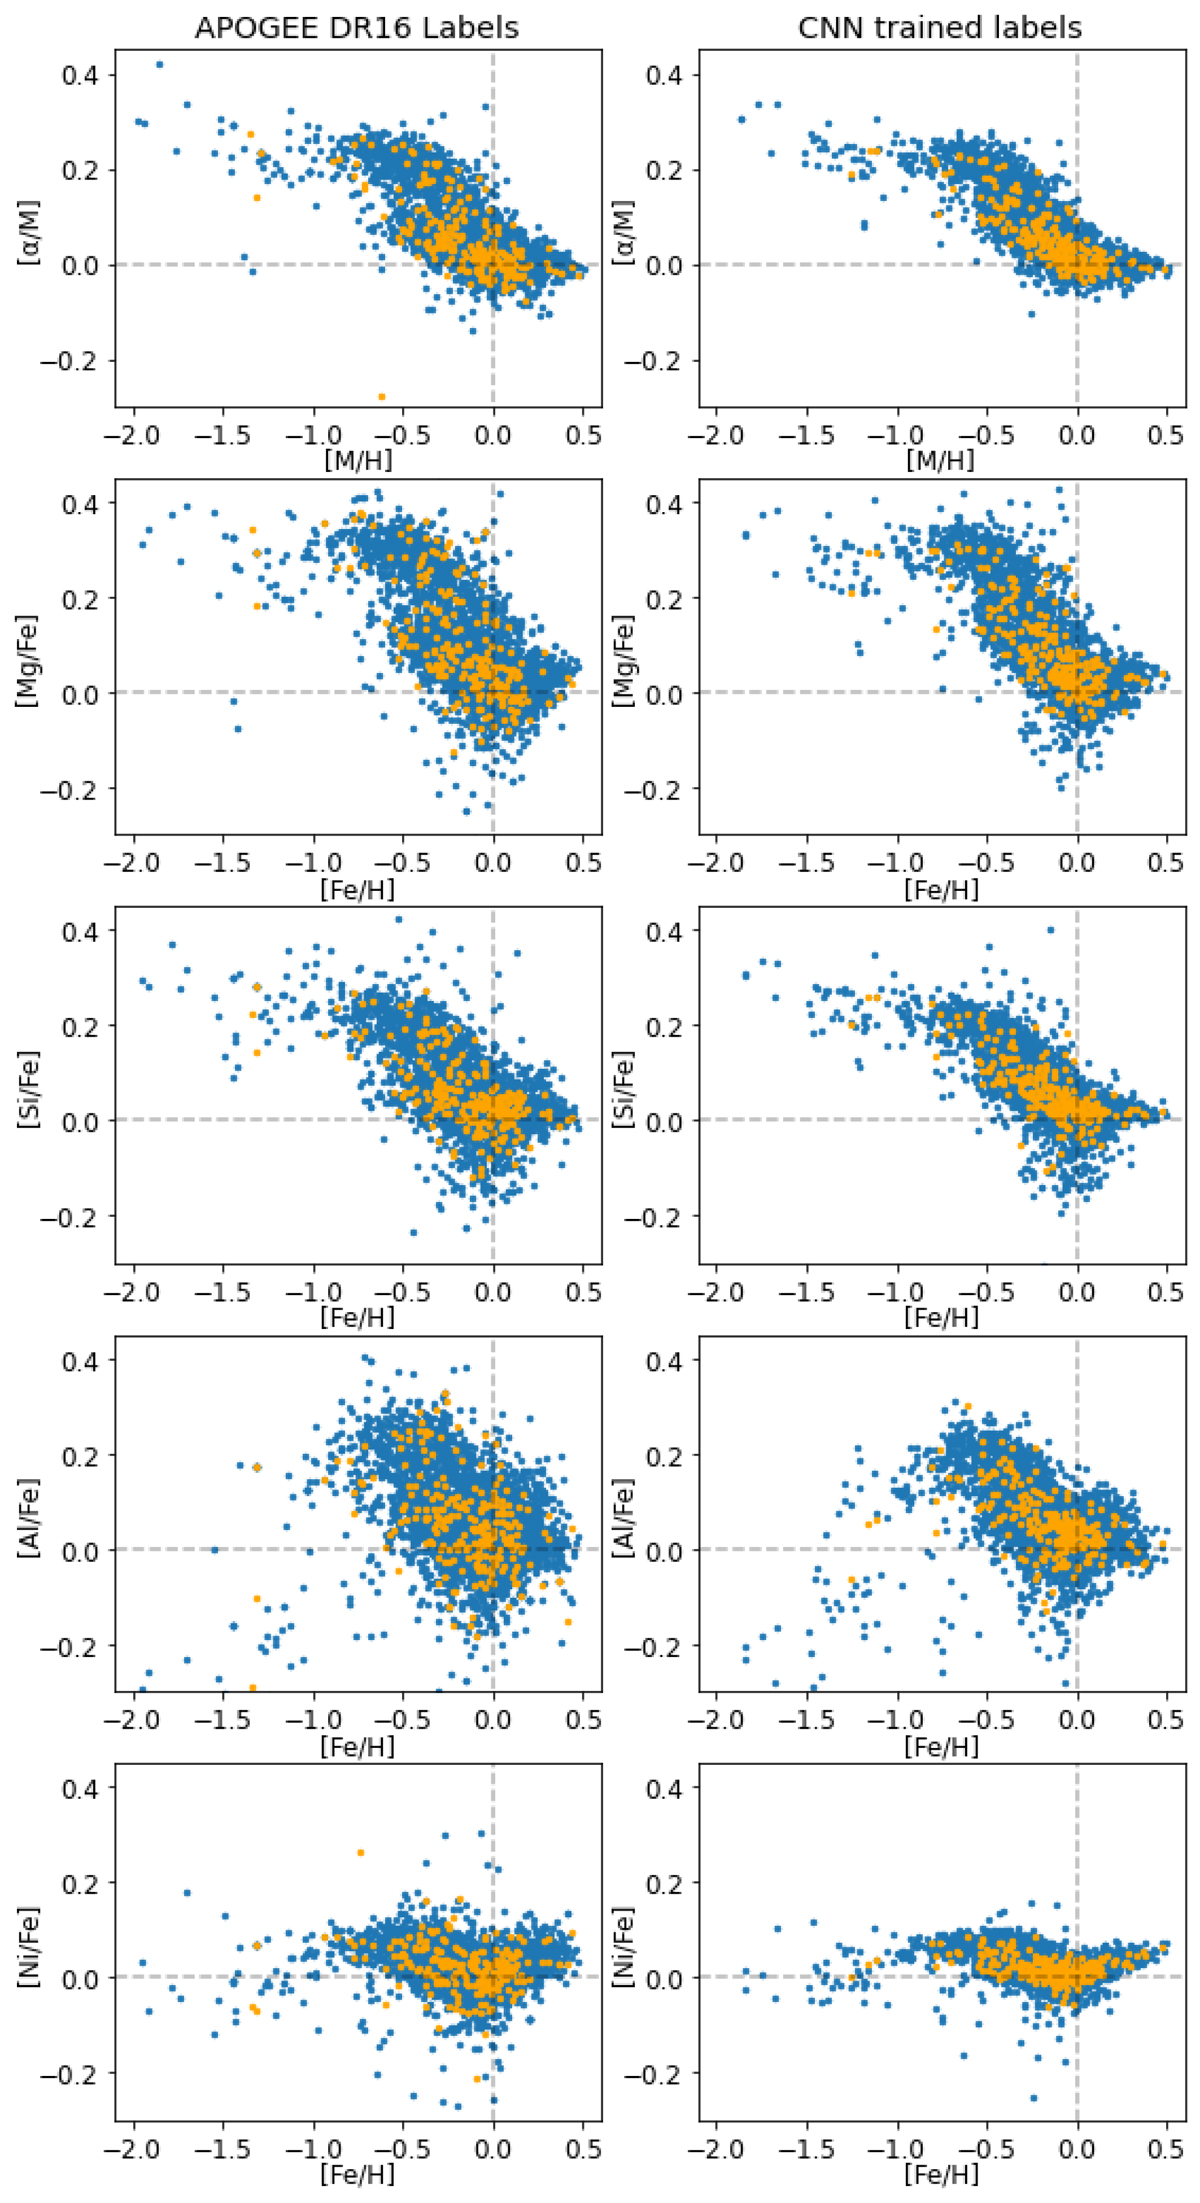
Left panels: abundance patterns of the APOGEE DR16 labels used as input for our CNN, for the training sample (blue) and for the test sample (orange). Right panels: abundance patterns of the averaged labels trained over 80 CNNs.
Current usage metrics show cumulative count of Article Views (full-text article views including HTML views, PDF and ePub downloads, according to the available data) and Abstracts Views on Vision4Press platform.
Data correspond to usage on the plateform after 2015. The current usage metrics is available 48-96 hours after online publication and is updated daily on week days.
Initial download of the metrics may take a while.