Fig. 7.
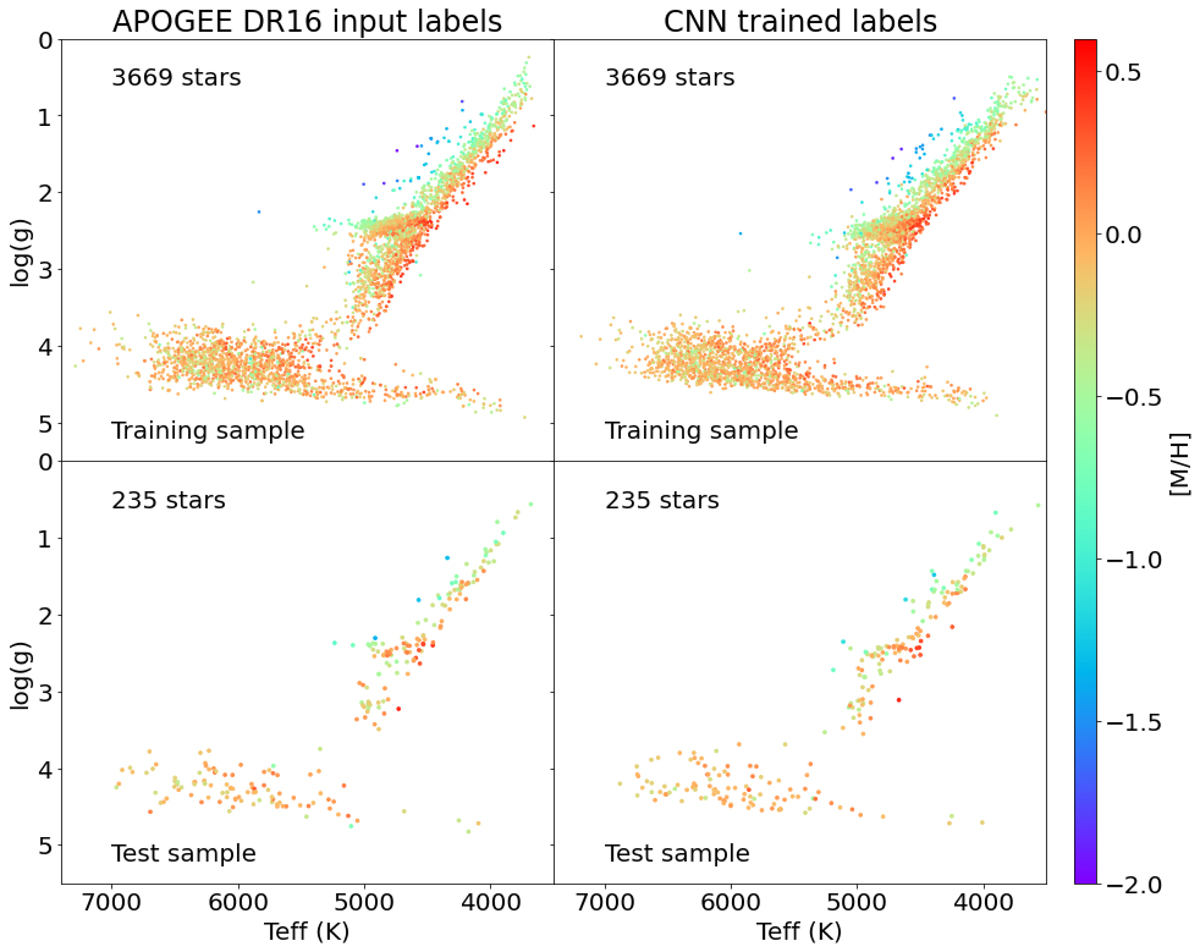
Top left: Kiel diagram of the APOGEE DR16 stars (used in the training sample), colour-coded with overall [M/H]. Top right: for the same stars, trained labels, averaged over 80 trained CNN. Bottom left: APOGEE DR16 parameters of the test sample. Bottom right: trained labels, averaged over 80 trained CNN, for the same test sample. Right panels: what the network learns from the APOGEE parameters (left panels).
Current usage metrics show cumulative count of Article Views (full-text article views including HTML views, PDF and ePub downloads, according to the available data) and Abstracts Views on Vision4Press platform.
Data correspond to usage on the plateform after 2015. The current usage metrics is available 48-96 hours after online publication and is updated daily on week days.
Initial download of the metrics may take a while.