Fig. 6.
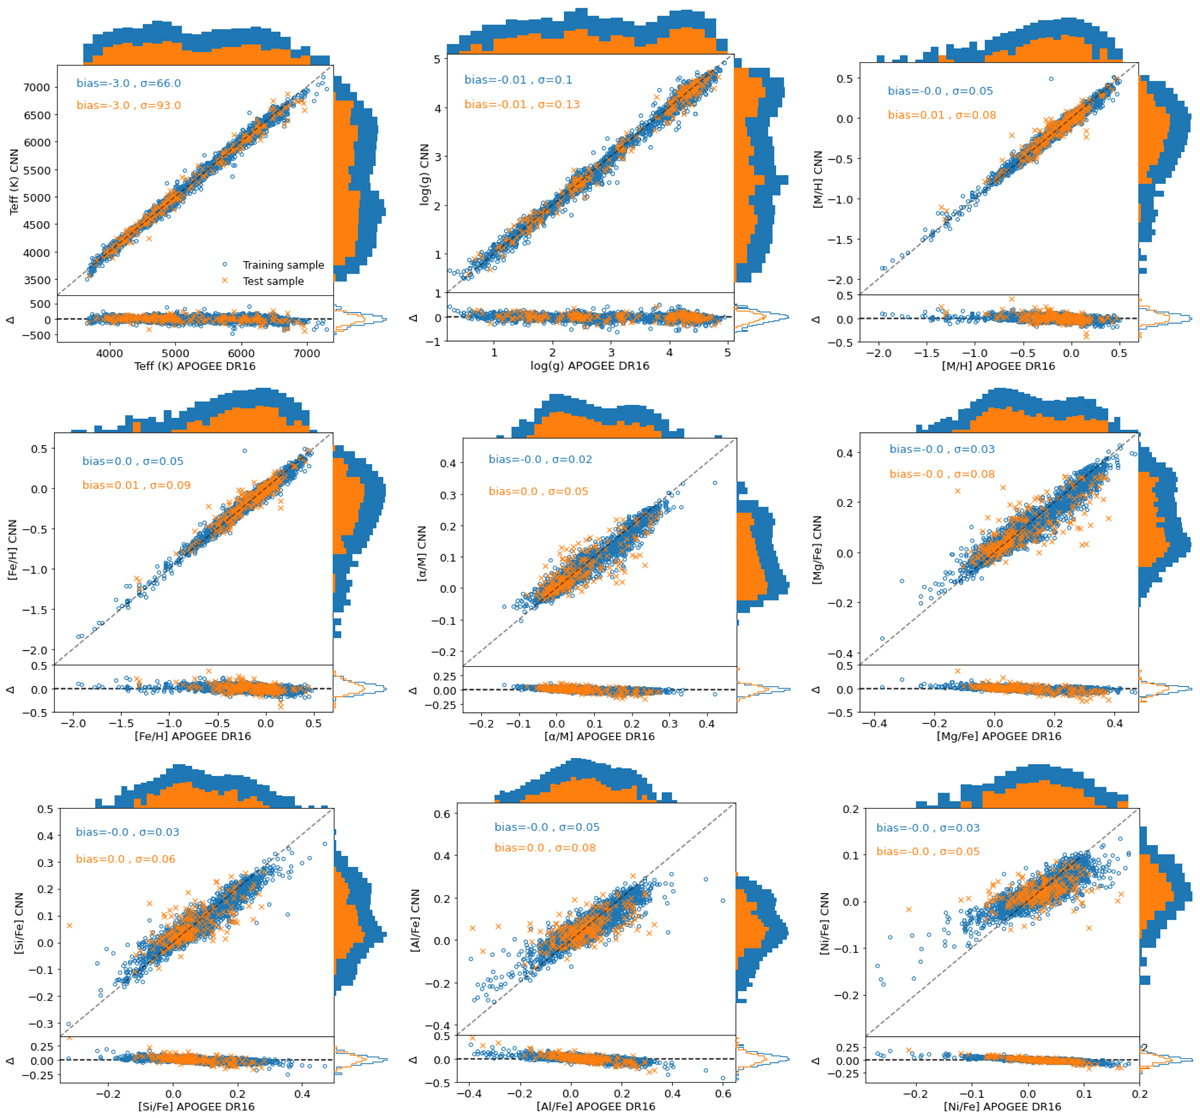
One-to-one relation between the CNN trained labels (y-axis) and the input labels (x-axis, APOGEE DR16 data). The training sample is plotted with blue circles, while the test sample is shown with orange crosses. The x- and y-axis parameters are presented as histograms with a logarithmic scale. For each parameter, a typical mean difference and scatter are computed in both sets. We plotted the difference Δ between the CNN trained labels and the APOGEE DR16 input labels with the same symbols and colours, and its histogram with a logarithmic scale.
Current usage metrics show cumulative count of Article Views (full-text article views including HTML views, PDF and ePub downloads, according to the available data) and Abstracts Views on Vision4Press platform.
Data correspond to usage on the plateform after 2015. The current usage metrics is available 48-96 hours after online publication and is updated daily on week days.
Initial download of the metrics may take a while.