Fig. 5.
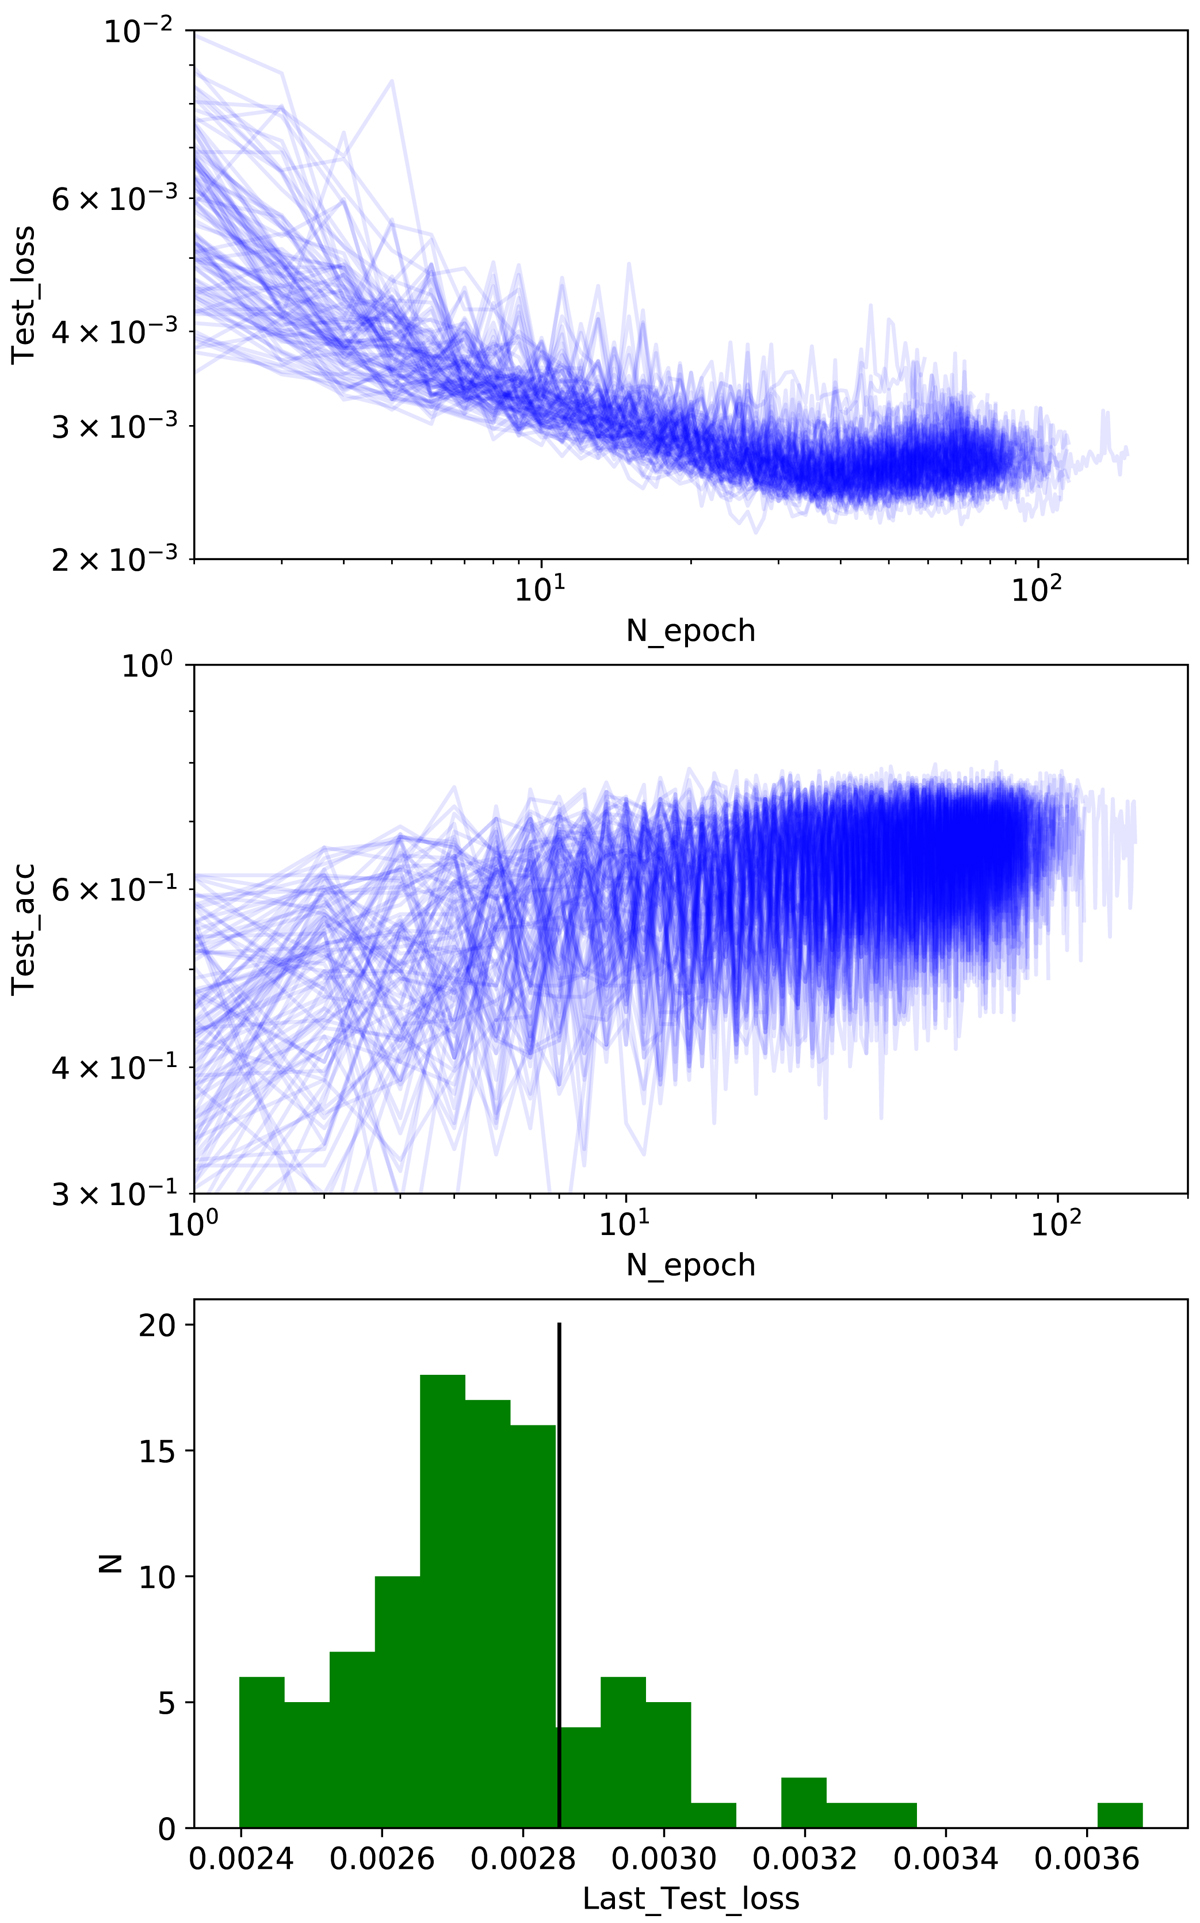
Top: value of the cost function for the test sample (Test_loss) for the 100 CNN runs as a function of the epoch. Middle: accuracy computed on the test sample (Test_acc) as a function of the epoch. Bottom: distribution of 100 values of Test_loss after the training was completed. Vertical black line indicates the 80th percentile of the distribution.
Current usage metrics show cumulative count of Article Views (full-text article views including HTML views, PDF and ePub downloads, according to the available data) and Abstracts Views on Vision4Press platform.
Data correspond to usage on the plateform after 2015. The current usage metrics is available 48-96 hours after online publication and is updated daily on week days.
Initial download of the metrics may take a while.