Free Access
Fig. A.1.
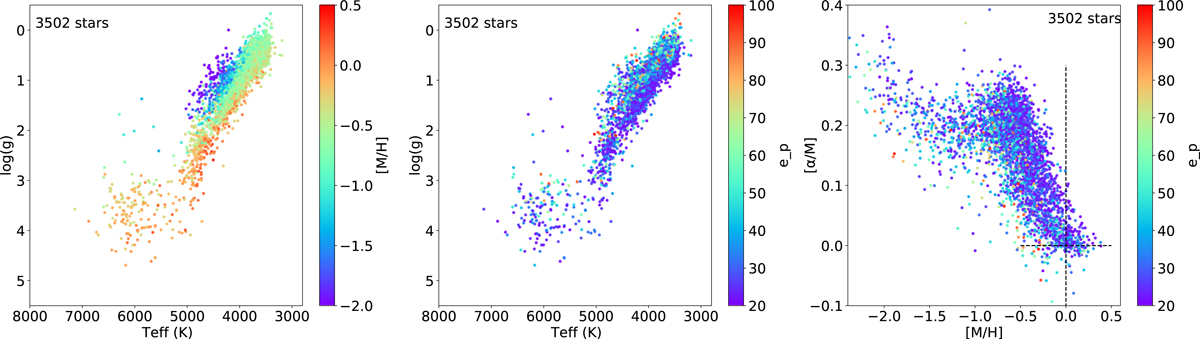
Kiel diagram of 3 502 stars of the observed sample, with ep > 20%, colour-coded by [M/H] (top panel) and ep (middle panel). Only stars with S/N > 50 per pixel are plotted. The same stars are presented in the bottom panels in the [α/M] versus [M/H] plane, colour-coded by parallax errors.
Current usage metrics show cumulative count of Article Views (full-text article views including HTML views, PDF and ePub downloads, according to the available data) and Abstracts Views on Vision4Press platform.
Data correspond to usage on the plateform after 2015. The current usage metrics is available 48-96 hours after online publication and is updated daily on week days.
Initial download of the metrics may take a while.