Fig. 21.
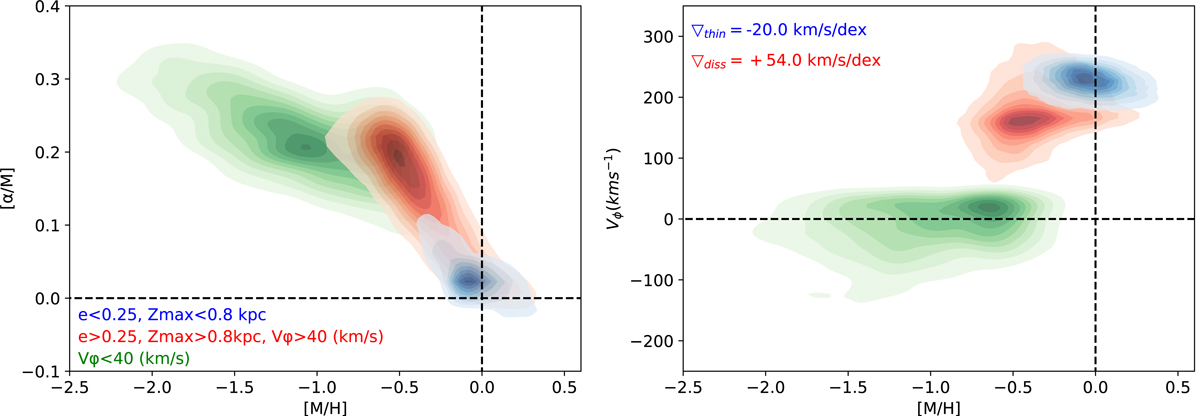
Left: [α/M] vs. [M/H] contour plots of the thin disc component (75 642 stars, blue), the dissipative collapse component (15 433 stars, red), and the accretion component (1400 stars, green). Right: galactocentric rotational velocities Vϕ as a function of [M/H]. We only show stars with parallax errors lower than 20%, S/N > 40 and “n&o” RAVE classification. We estimated the gradients of Vϕ vs. [Fe/H] in the thin disc component and in the dissipative collapse component and find good agreement with literature values, depsite our different selection criteria (see for example Kordopatis et al. 2011b; Lee et al. 2011).
Current usage metrics show cumulative count of Article Views (full-text article views including HTML views, PDF and ePub downloads, according to the available data) and Abstracts Views on Vision4Press platform.
Data correspond to usage on the plateform after 2015. The current usage metrics is available 48-96 hours after online publication and is updated daily on week days.
Initial download of the metrics may take a while.