Fig. 2.
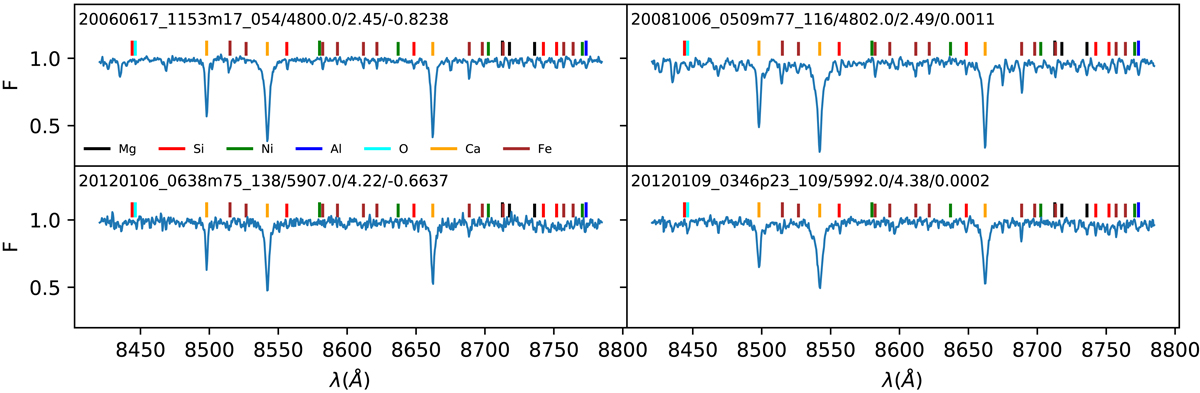
Example of four typical metal-poor and metal-rich dwarfs and giants RAVE spectra from the training sample. The RAVE_OBS_IDs and the atmospheric parameters are indicated in the top left corner of each panel. Apart from the prominent CaII triplet lines, the RAVE spectra also show a variety of more subtle spectral features (main chemical abundance diagnostic lines are over-plotted).
Current usage metrics show cumulative count of Article Views (full-text article views including HTML views, PDF and ePub downloads, according to the available data) and Abstracts Views on Vision4Press platform.
Data correspond to usage on the plateform after 2015. The current usage metrics is available 48-96 hours after online publication and is updated daily on week days.
Initial download of the metrics may take a while.