Fig. 16.
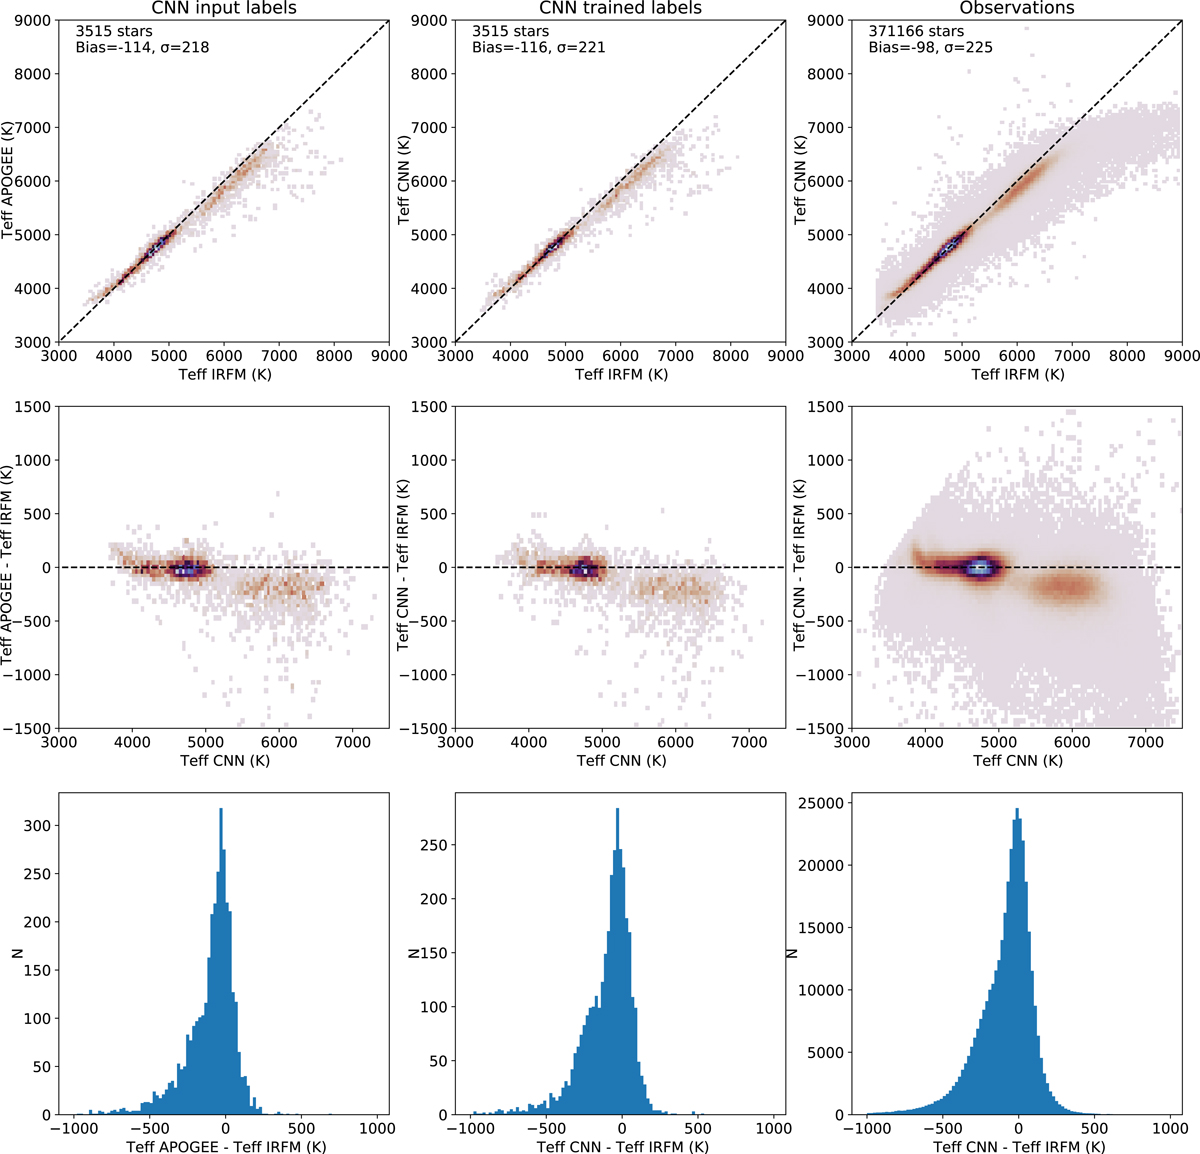
Left: comparisons of the input label Teff for our CNN (APOGEE DR16 labels) with the IRFM temperatures of Steinmetz et al. (2020b). Mean difference and scatter are indicated in the top-left corner. We also show a residual plot and an histogram of the difference. Middle: comparison of the labels Teff trained by the CNN with the IRFM temperatures of Steinmetz et al. (2020b). Right: comparison of the Teff values derived for our whole observed data-set (for S/N > 20) with the IRFM temperatures of Steinmetz et al. (2020b).
Current usage metrics show cumulative count of Article Views (full-text article views including HTML views, PDF and ePub downloads, according to the available data) and Abstracts Views on Vision4Press platform.
Data correspond to usage on the plateform after 2015. The current usage metrics is available 48-96 hours after online publication and is updated daily on week days.
Initial download of the metrics may take a while.