Fig. 11.
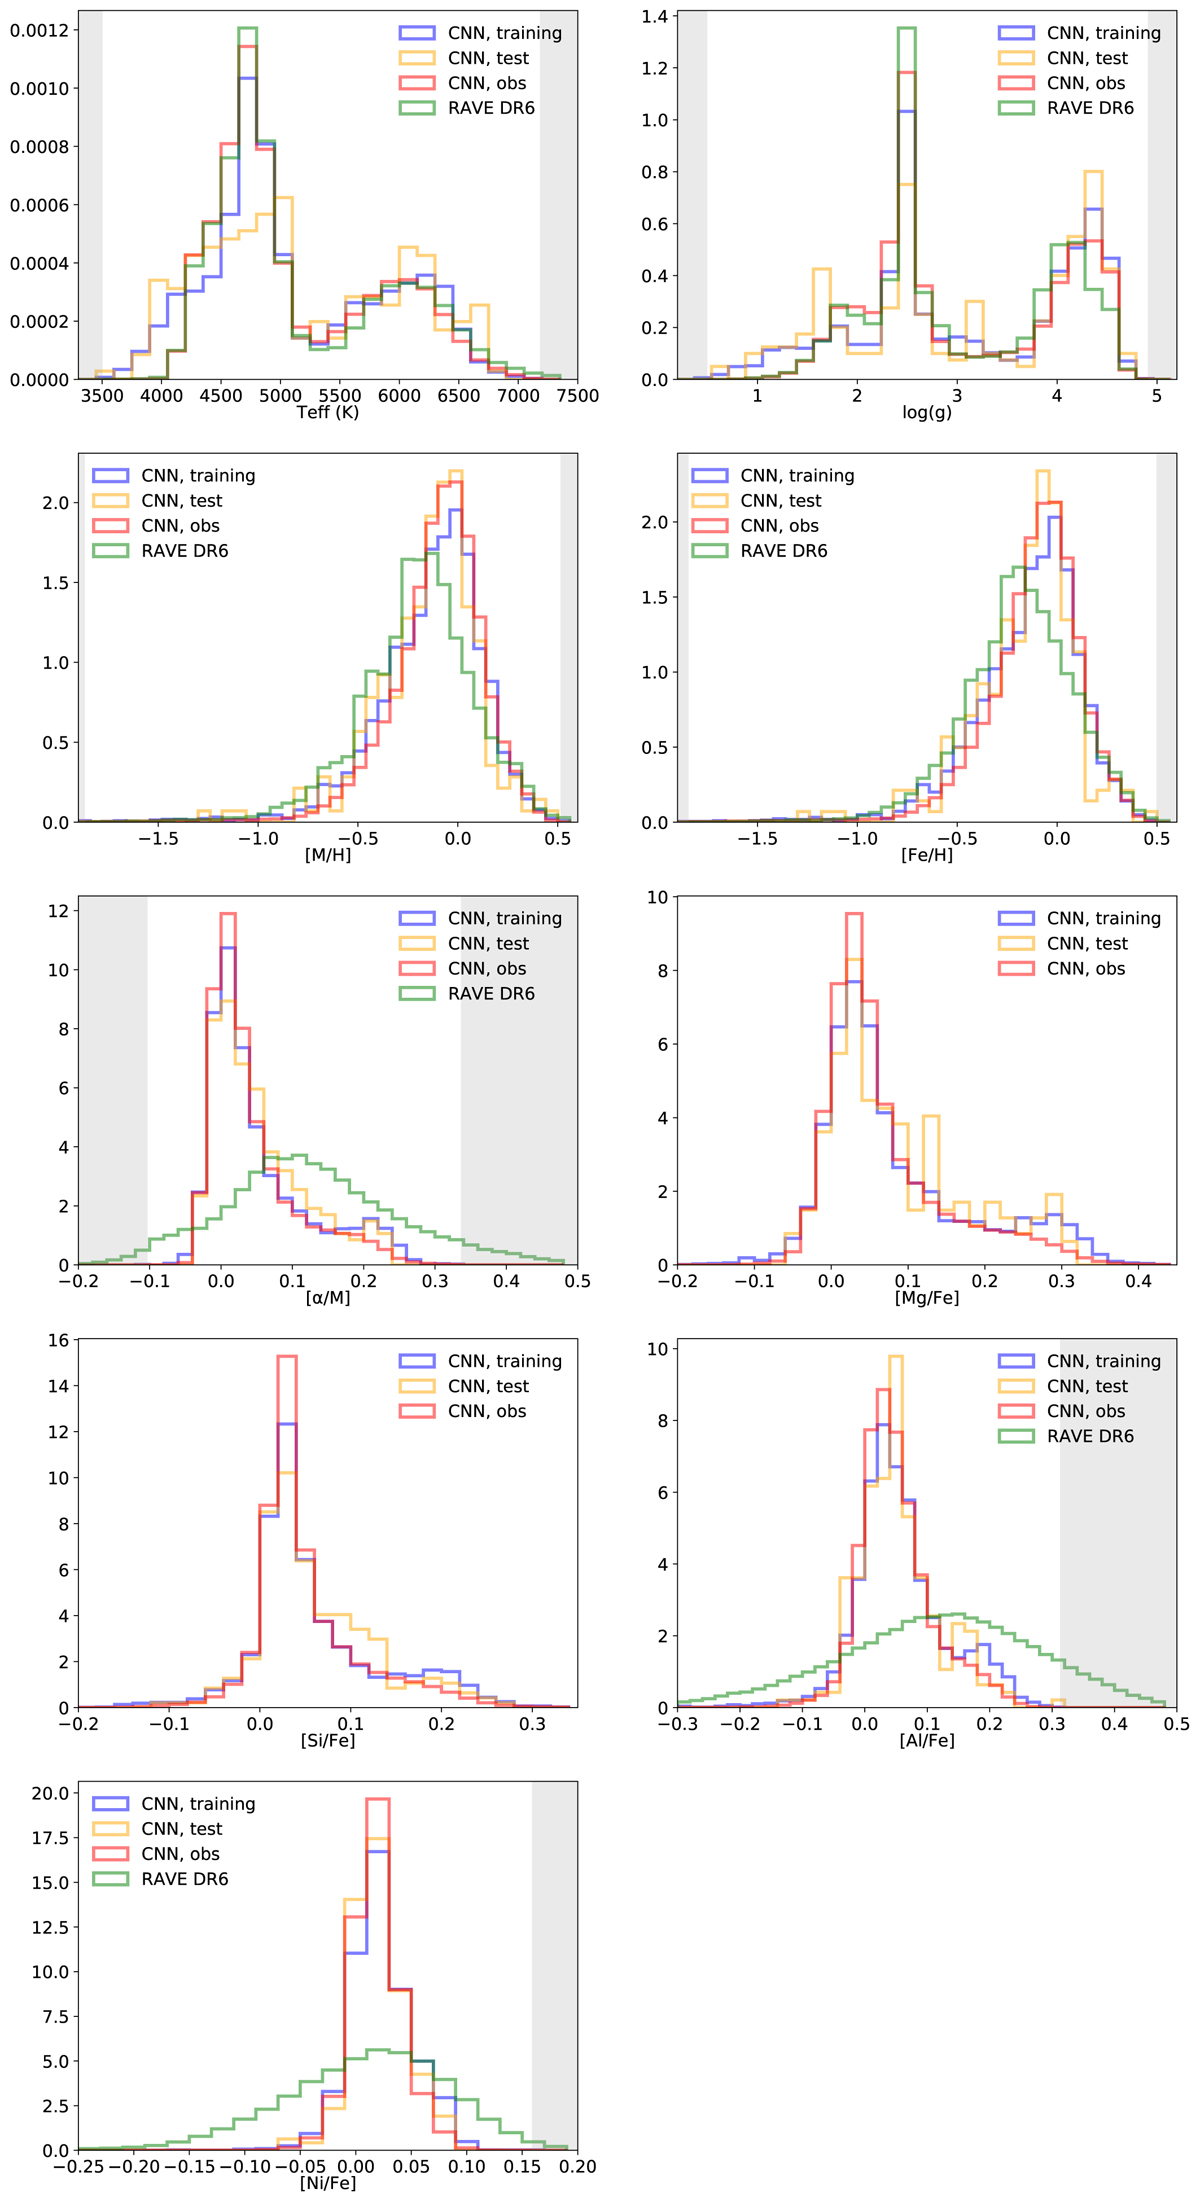
Normalised distribution of atmospheric parameters and abundances in the training sample (blue), in the test sample (yellow), and the observed sample (red). For the same stars of the observed sample, we show a normalised distribution of the corresponding RAVE DR6 parameters (taken from Steinmetz et al. 2020b). The grey areas define the zones outside the limits of the training sample parameters space.
Current usage metrics show cumulative count of Article Views (full-text article views including HTML views, PDF and ePub downloads, according to the available data) and Abstracts Views on Vision4Press platform.
Data correspond to usage on the plateform after 2015. The current usage metrics is available 48-96 hours after online publication and is updated daily on week days.
Initial download of the metrics may take a while.