Free Access
Fig. 3
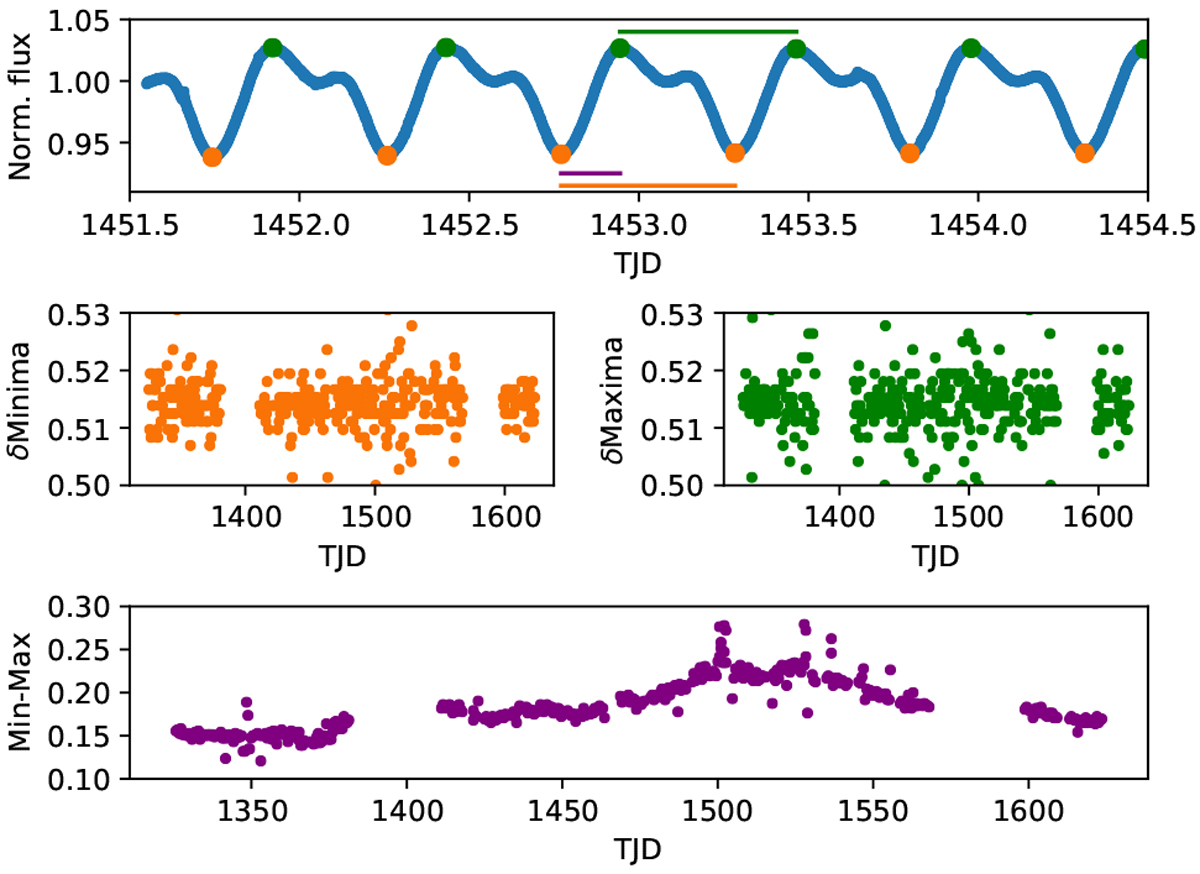
Min-max measurements. One can see a definition of the terms minima (orange), their difference δmin (orange line), maxima (green), their difference δmax (green line), and the difference min-max (purple line); their distributions (middle panels); and the evolution of their difference (bottom panel).
Current usage metrics show cumulative count of Article Views (full-text article views including HTML views, PDF and ePub downloads, according to the available data) and Abstracts Views on Vision4Press platform.
Data correspond to usage on the plateform after 2015. The current usage metrics is available 48-96 hours after online publication and is updated daily on week days.
Initial download of the metrics may take a while.