Fig. 2
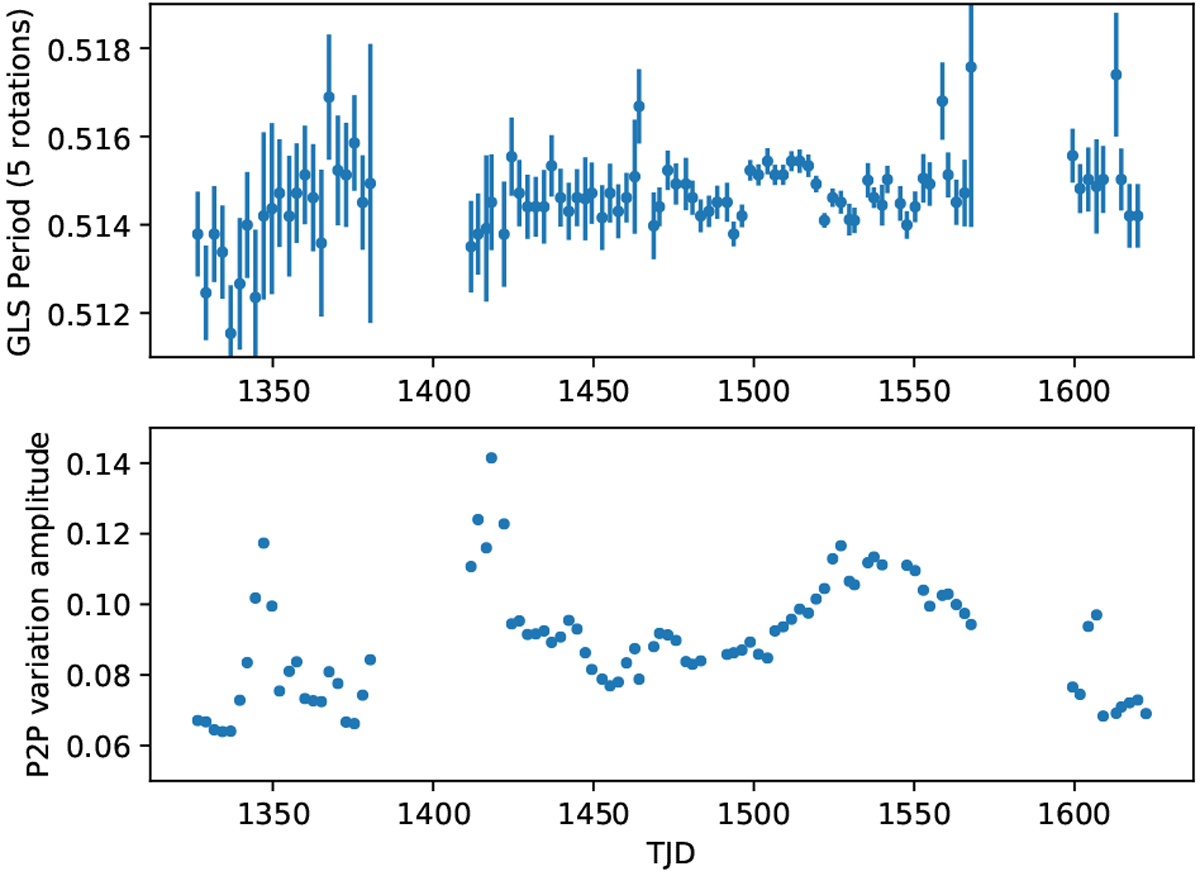
Top panel: variation of the GLS periodogram of the light curve of AB Dor, split into parts containingfive rotations each. We note that the reduced error sizes in the time range between 1500 ≲ TJD ≲ 1550 are related to the shape of the light curve during that time (which is closer to sinusoidal than the rest of the light curve) and the GLS periodogram’s ability to measure the periods of sinusoidal-like signals more accurately. Bottom panel: mean peak-to-peak variation amplitude assuming sets of five rotations (the y-axis is in normalized flux units).
Current usage metrics show cumulative count of Article Views (full-text article views including HTML views, PDF and ePub downloads, according to the available data) and Abstracts Views on Vision4Press platform.
Data correspond to usage on the plateform after 2015. The current usage metrics is available 48-96 hours after online publication and is updated daily on week days.
Initial download of the metrics may take a while.