Fig. 8.
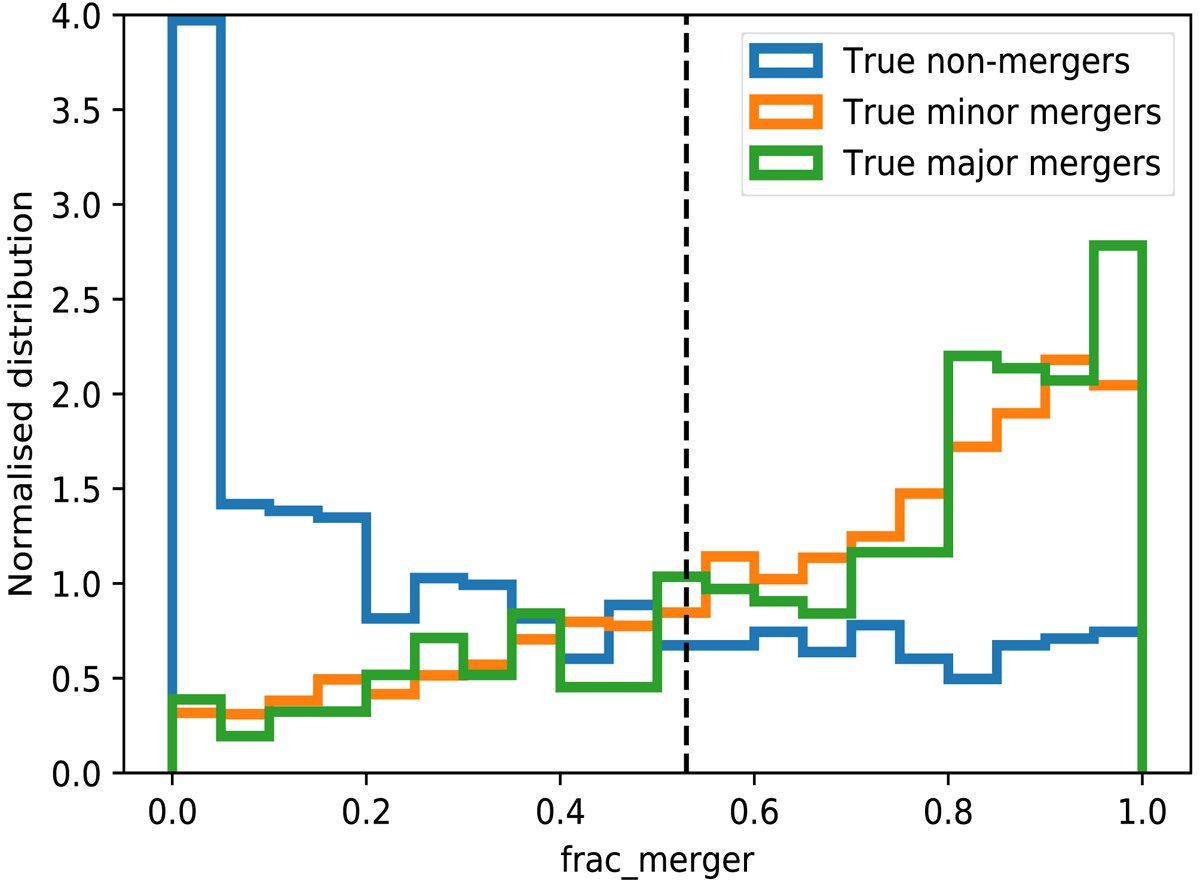
Normalised distribution (meaning the area under each histogram sums to unity) in the CNN-derived probability of major merger for the real major mergers, real minor mergers, and real non-mergers in the test set from the TNG simulations. The vertical dashed line indicates the threshold of frac_merger > 0.53, which is used to define a major merger detected by the network.
Current usage metrics show cumulative count of Article Views (full-text article views including HTML views, PDF and ePub downloads, according to the available data) and Abstracts Views on Vision4Press platform.
Data correspond to usage on the plateform after 2015. The current usage metrics is available 48-96 hours after online publication and is updated daily on week days.
Initial download of the metrics may take a while.