Fig. 6.
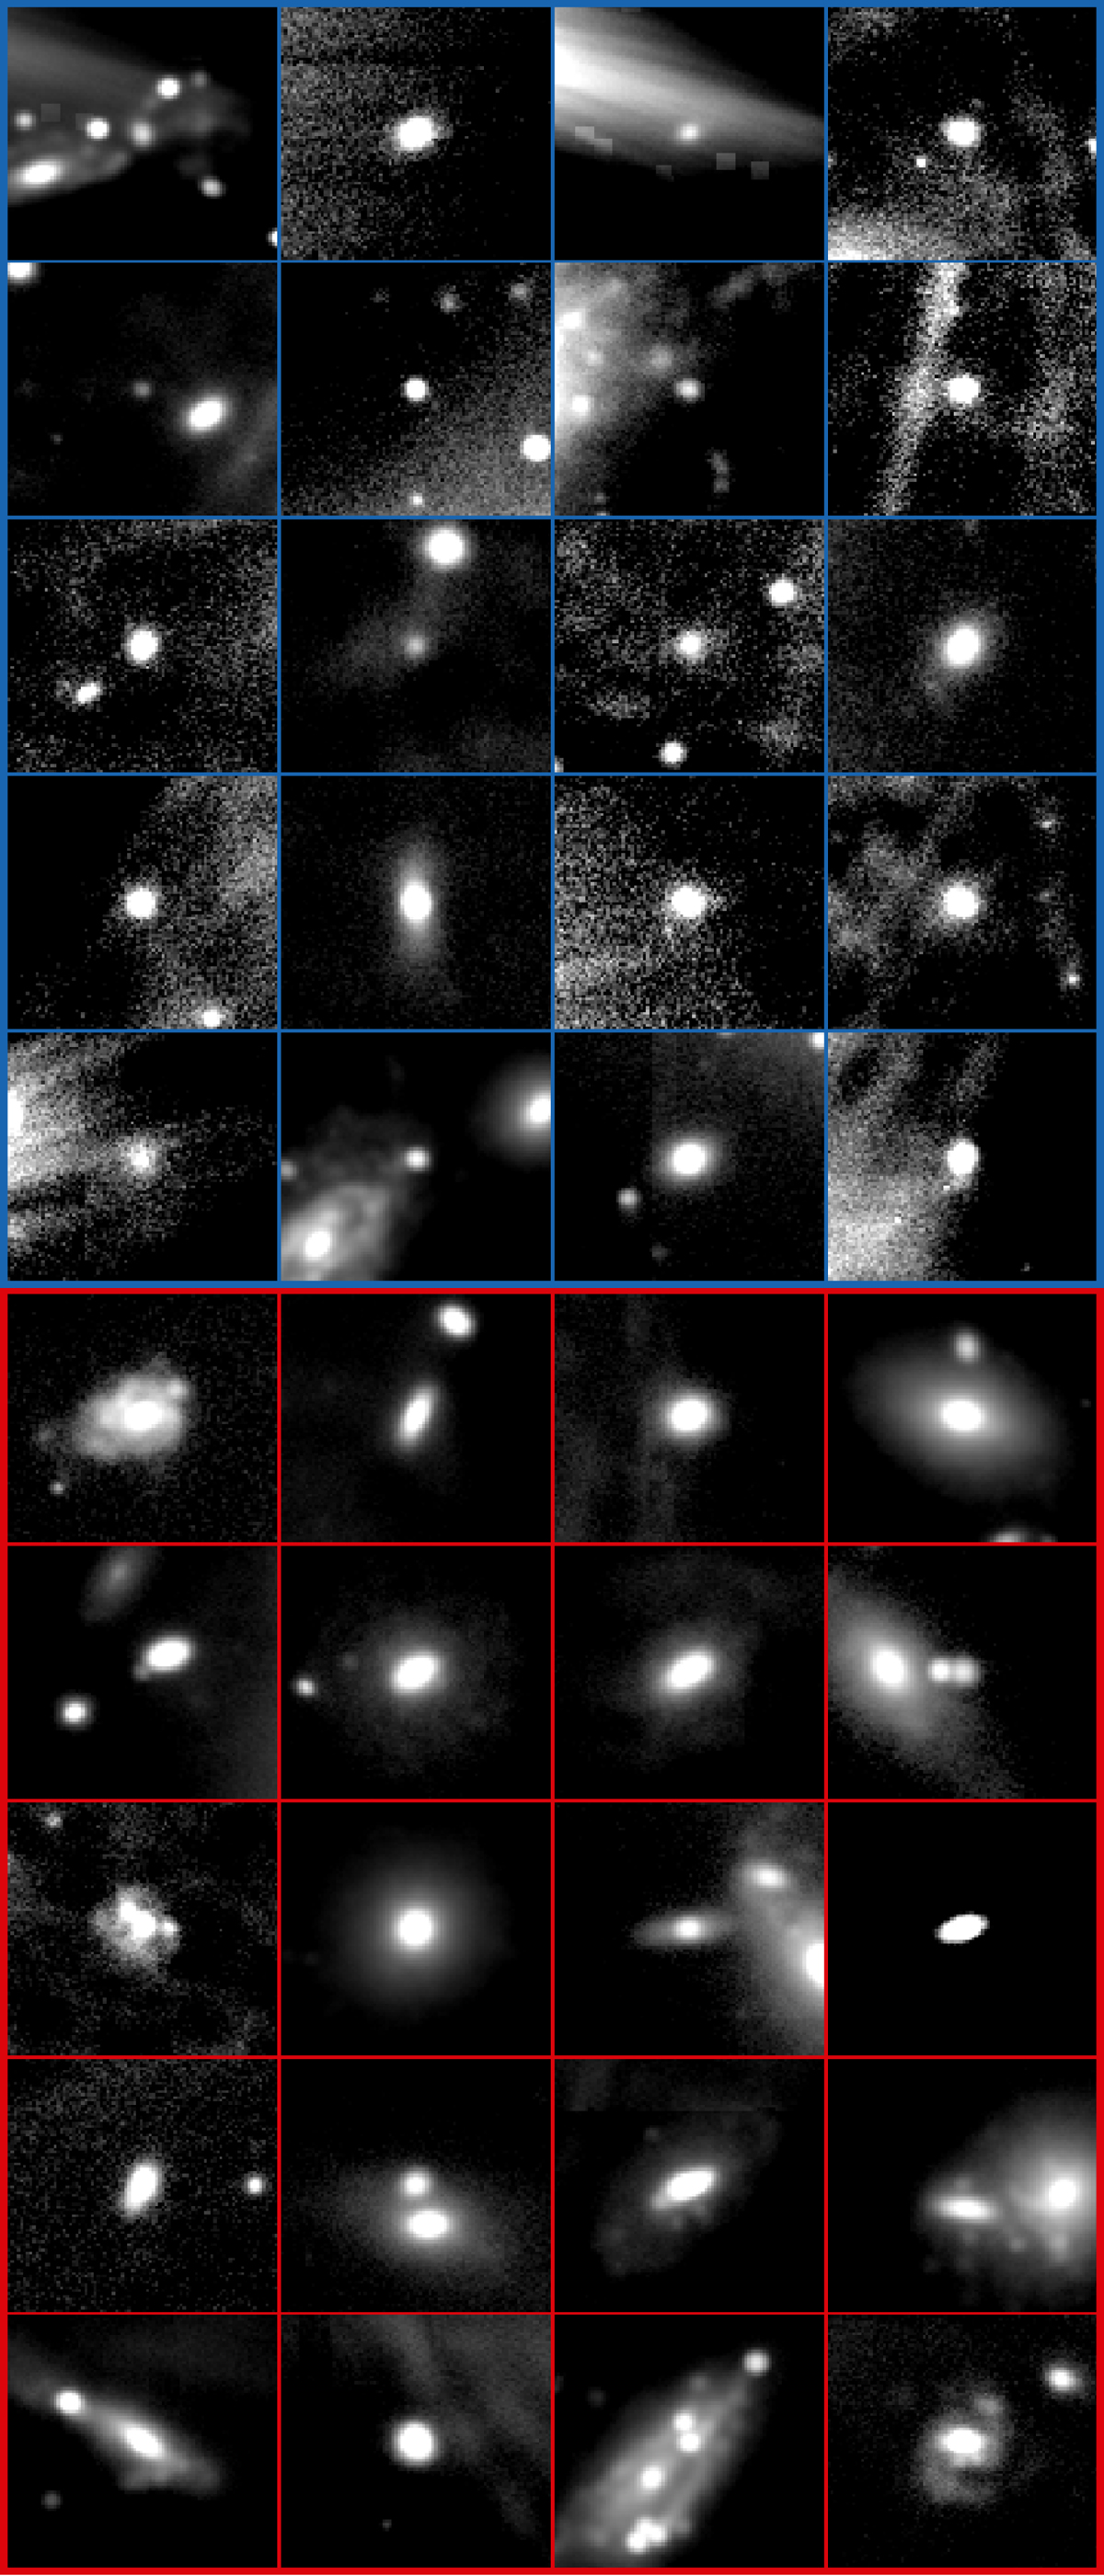
Randomly selected examples of true TNG non-mergers that are correctly and incorrectly identified by our network. The top five rows (outlined in blue) show examples of true non-mergers that are correctly identified as non-mergers. The bottom five rows (outlined in red) show examples of true non-mergers that are incorrectly identified as major mergers.
Current usage metrics show cumulative count of Article Views (full-text article views including HTML views, PDF and ePub downloads, according to the available data) and Abstracts Views on Vision4Press platform.
Data correspond to usage on the plateform after 2015. The current usage metrics is available 48-96 hours after online publication and is updated daily on week days.
Initial download of the metrics may take a while.