Free Access
Fig. A.1.
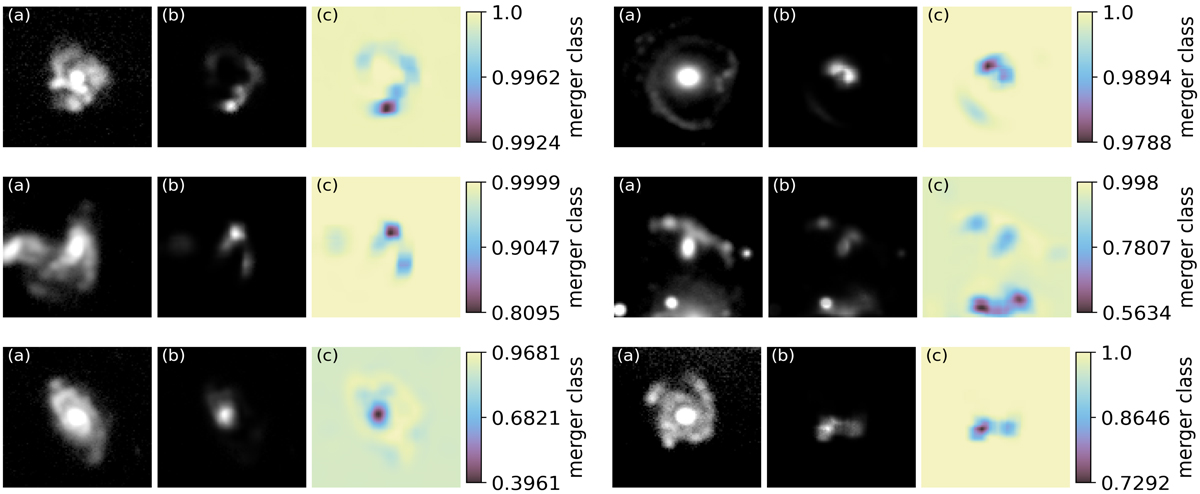
Heat maps demonstrating how the network detect example major mergers. Panel a: original image of the merging galaxy being classified, panel b: regions that most effect the merger classification and panel c: heat maps where regions with darker colours have a greater effect on the classification.
Current usage metrics show cumulative count of Article Views (full-text article views including HTML views, PDF and ePub downloads, according to the available data) and Abstracts Views on Vision4Press platform.
Data correspond to usage on the plateform after 2015. The current usage metrics is available 48-96 hours after online publication and is updated daily on week days.
Initial download of the metrics may take a while.