Fig. 3.
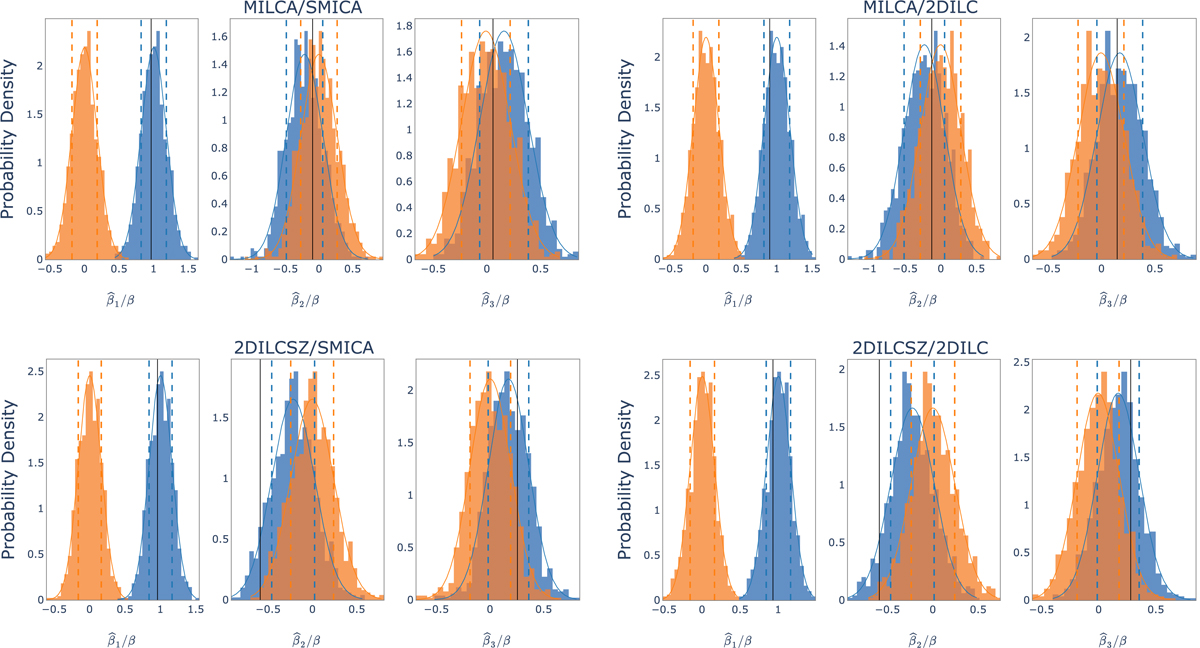
Histograms of ![]() values (with 1, 2, and 3 corresponding to the CMB dipole direction, Galactic plane, and a third orthogonal direction) using the map-space analysis for MILCA (top) and 2D-ILC (bottom) y maps, and for CMB template maps SMICA-NOSZ (left) and 2D-ILC (right). Blue histograms are simulations with the dipolar modulation term, and orange histograms are simulations without. Black vertical lines denote the values of the data, demonstrating that they are much more consistent with the existence of the dipolar modulation term than without it. Dashed lines show the 68% regions for a Gaussian fit to the histograms.
values (with 1, 2, and 3 corresponding to the CMB dipole direction, Galactic plane, and a third orthogonal direction) using the map-space analysis for MILCA (top) and 2D-ILC (bottom) y maps, and for CMB template maps SMICA-NOSZ (left) and 2D-ILC (right). Blue histograms are simulations with the dipolar modulation term, and orange histograms are simulations without. Black vertical lines denote the values of the data, demonstrating that they are much more consistent with the existence of the dipolar modulation term than without it. Dashed lines show the 68% regions for a Gaussian fit to the histograms.
Current usage metrics show cumulative count of Article Views (full-text article views including HTML views, PDF and ePub downloads, according to the available data) and Abstracts Views on Vision4Press platform.
Data correspond to usage on the plateform after 2015. The current usage metrics is available 48-96 hours after online publication and is updated daily on week days.
Initial download of the metrics may take a while.