Fig. 2.
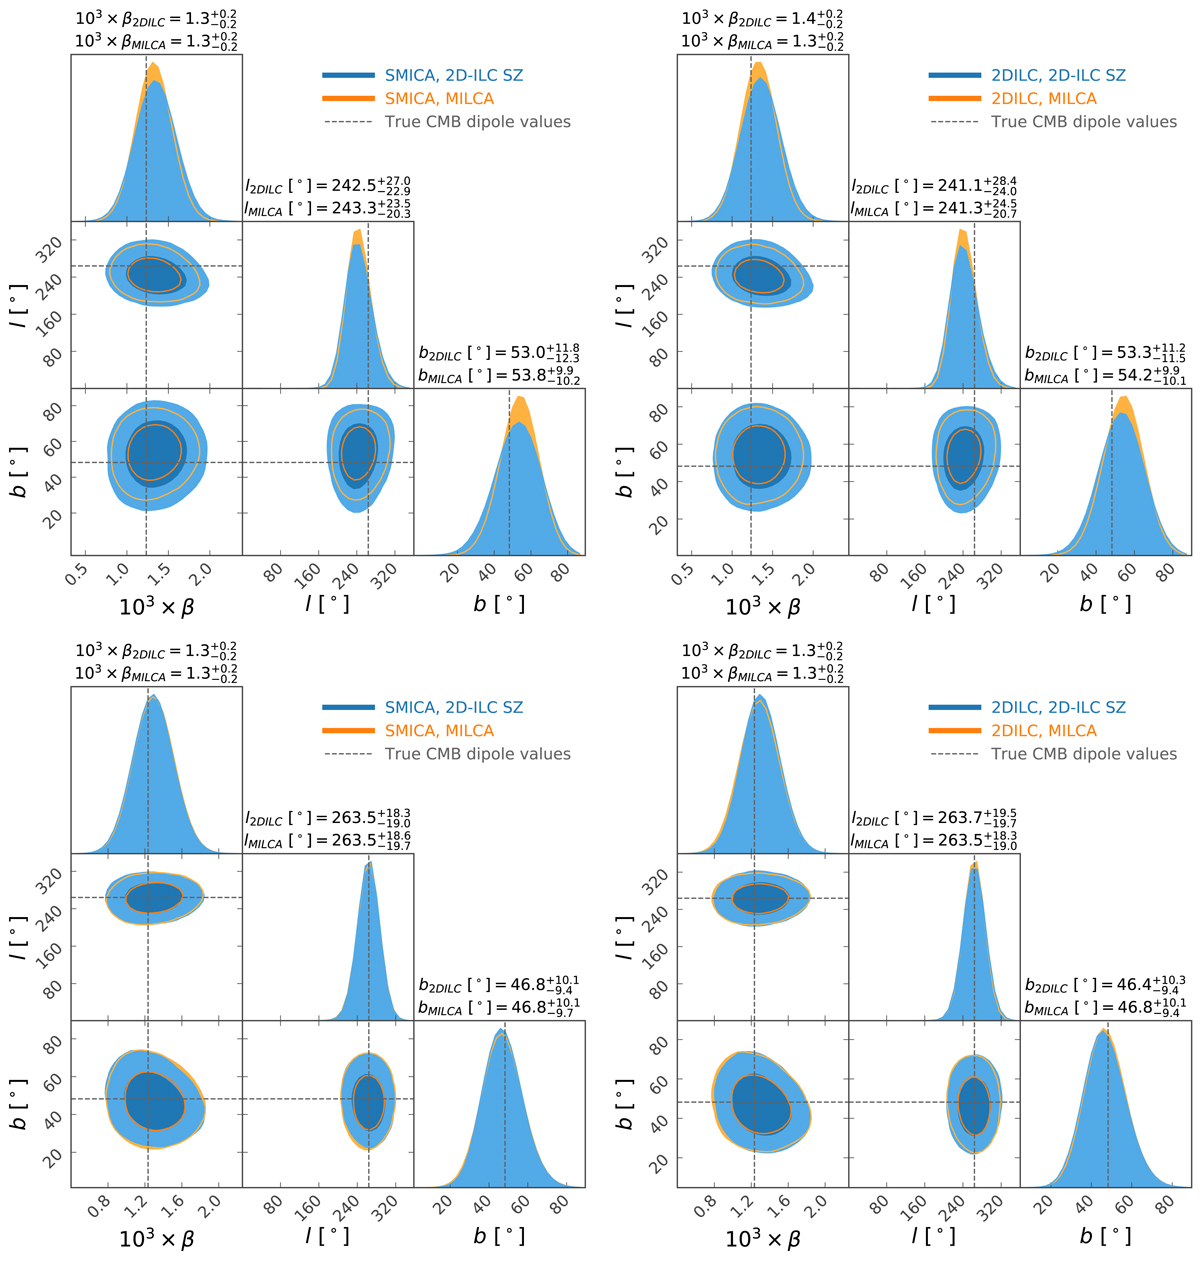
Posteriors for the CMB dipole parameters using the map-space analysis (top) and harmonic-space analysis (bottom). The left panels use the SMICA-NOSZ CMB maps, whereas the right use the 2D-ILC CMB maps. MILCA y map results are shown in orange, and 2D-ILC y map results are shown in blue. Black dashed lines show the best-fit parameters from direct measurements of the CMB dipole. Dark and light contours enclose 68% and 95%, respectively. Titles for each panel give the best-fit results, along with the 68% uncertainties.
Current usage metrics show cumulative count of Article Views (full-text article views including HTML views, PDF and ePub downloads, according to the available data) and Abstracts Views on Vision4Press platform.
Data correspond to usage on the plateform after 2015. The current usage metrics is available 48-96 hours after online publication and is updated daily on week days.
Initial download of the metrics may take a while.