Fig. 1.
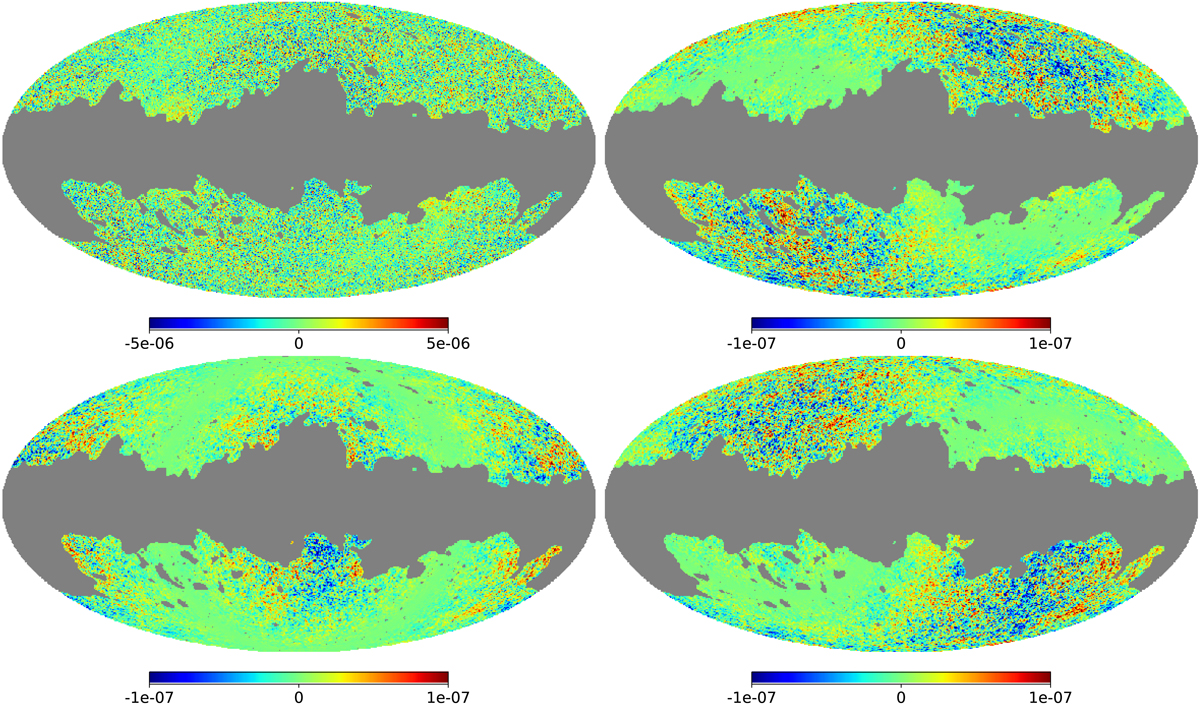
Map of the tSZ effect from the MILCA component-separation method in y-map units (top left) and the expected modulated CMB signal (top right) generated using the SMICA-NOSZ CMB map in units of T0. The bottom left and right figures are the CMB anisotropies modulated in orthogonal directions to the CMB dipole, as explained in the text after Eq. (17). The greyed out region shows the mask used for our analysis. NILC and 2D-ILC y maps, as well as 2D-ILC CMB modulated anisotropies, are not shown, since they look essentially the same as the maps presented here. Note that the map of the tSZ effect (top left) has a different scale bar when compared to the other three (i.e., the modulation signal is about 50 times weaker).
Current usage metrics show cumulative count of Article Views (full-text article views including HTML views, PDF and ePub downloads, according to the available data) and Abstracts Views on Vision4Press platform.
Data correspond to usage on the plateform after 2015. The current usage metrics is available 48-96 hours after online publication and is updated daily on week days.
Initial download of the metrics may take a while.