Fig. 3.
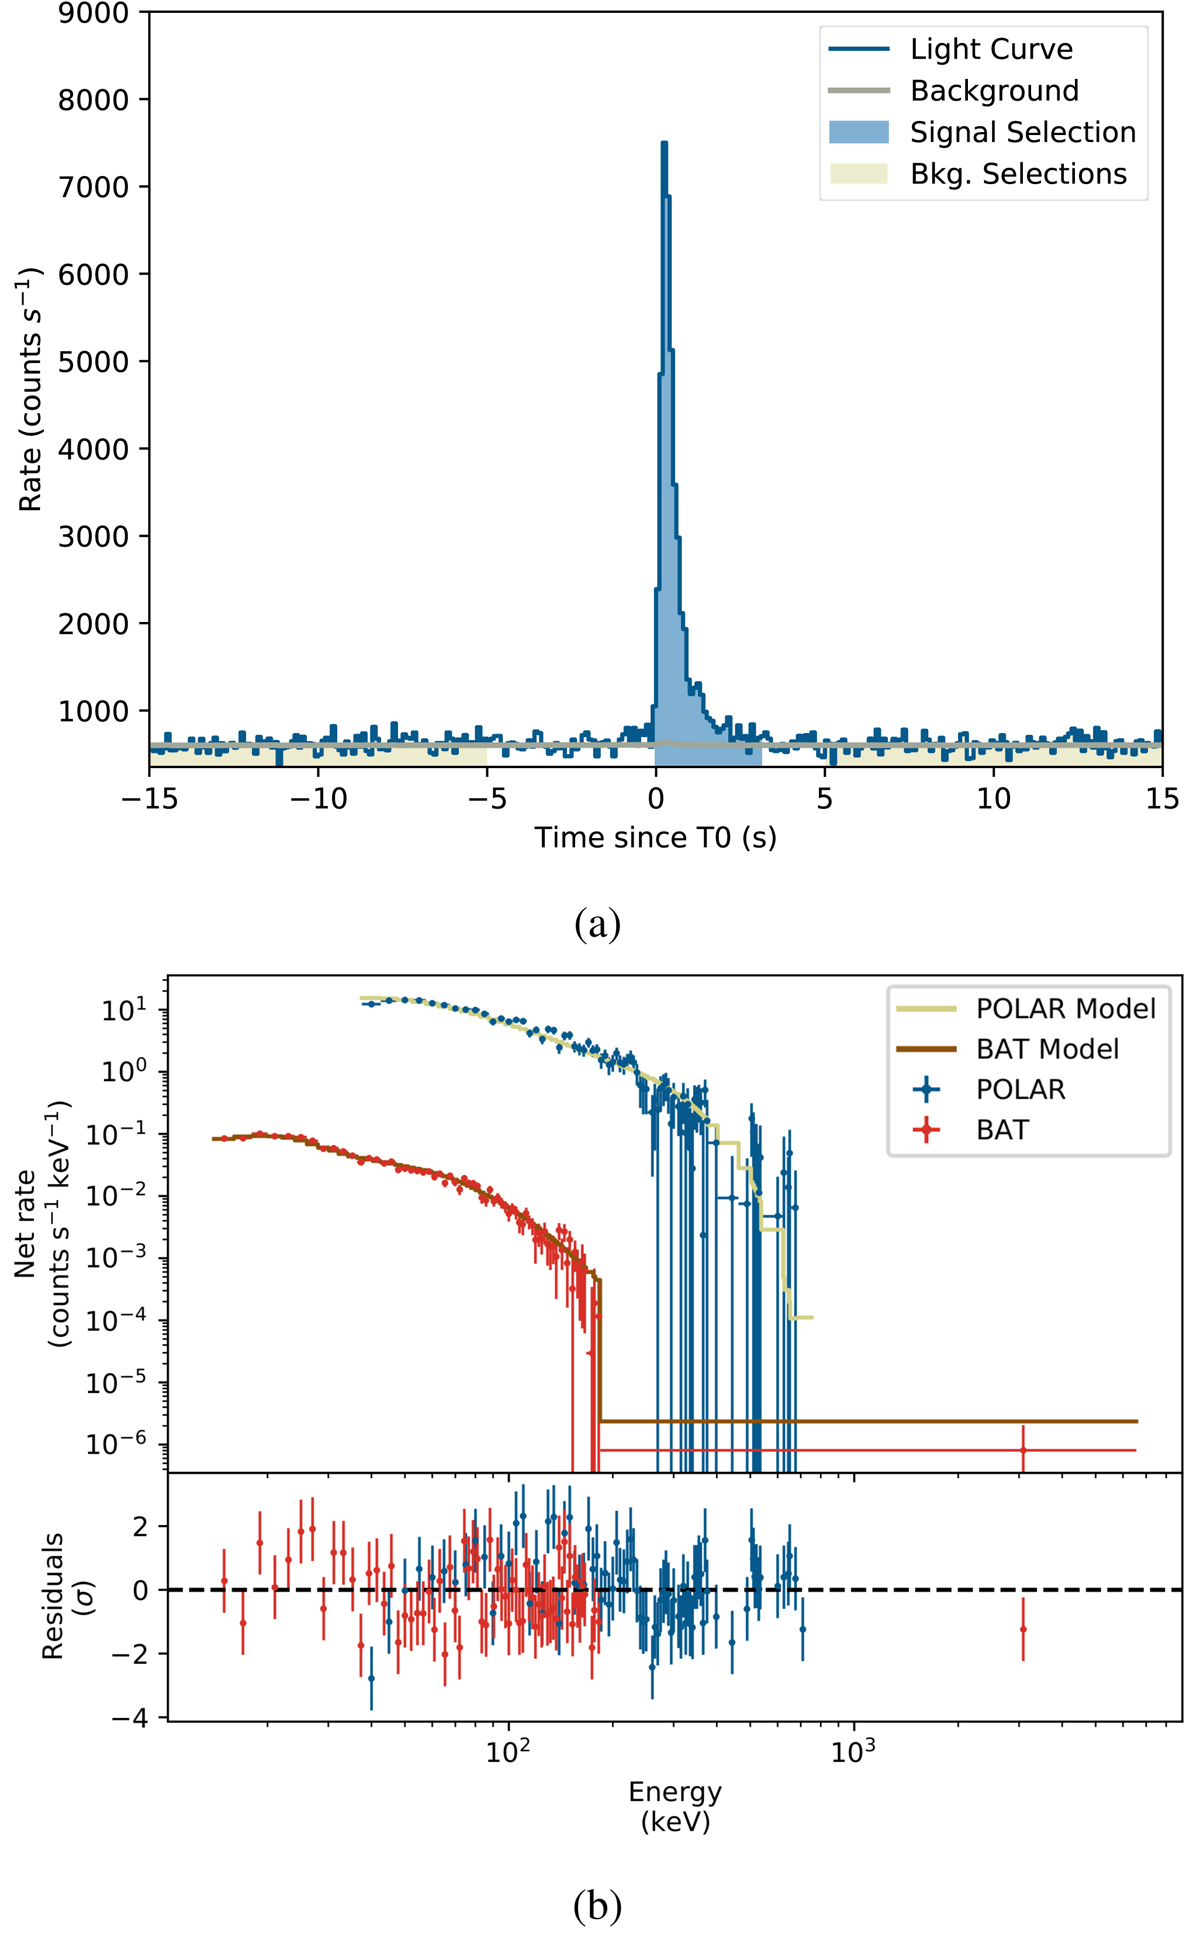
Panel a: light curve of GRB 170101A as measured by POLAR where T = 0 s is defined as the T0 defined by Swift-BAT for this GRB. Panel b: joint spectral fit result for 170101A. The number of counts as detected by both POLAR (blue) and Swift-BAT (red) are shown along with the best fitting spectrum folded through the instrument responses in yellow for POLAR data and in brown for Swift-BAT data. The residuals for both data sets are shown at the bottom of the figure.
Current usage metrics show cumulative count of Article Views (full-text article views including HTML views, PDF and ePub downloads, according to the available data) and Abstracts Views on Vision4Press platform.
Data correspond to usage on the plateform after 2015. The current usage metrics is available 48-96 hours after online publication and is updated daily on week days.
Initial download of the metrics may take a while.