Fig. 2.
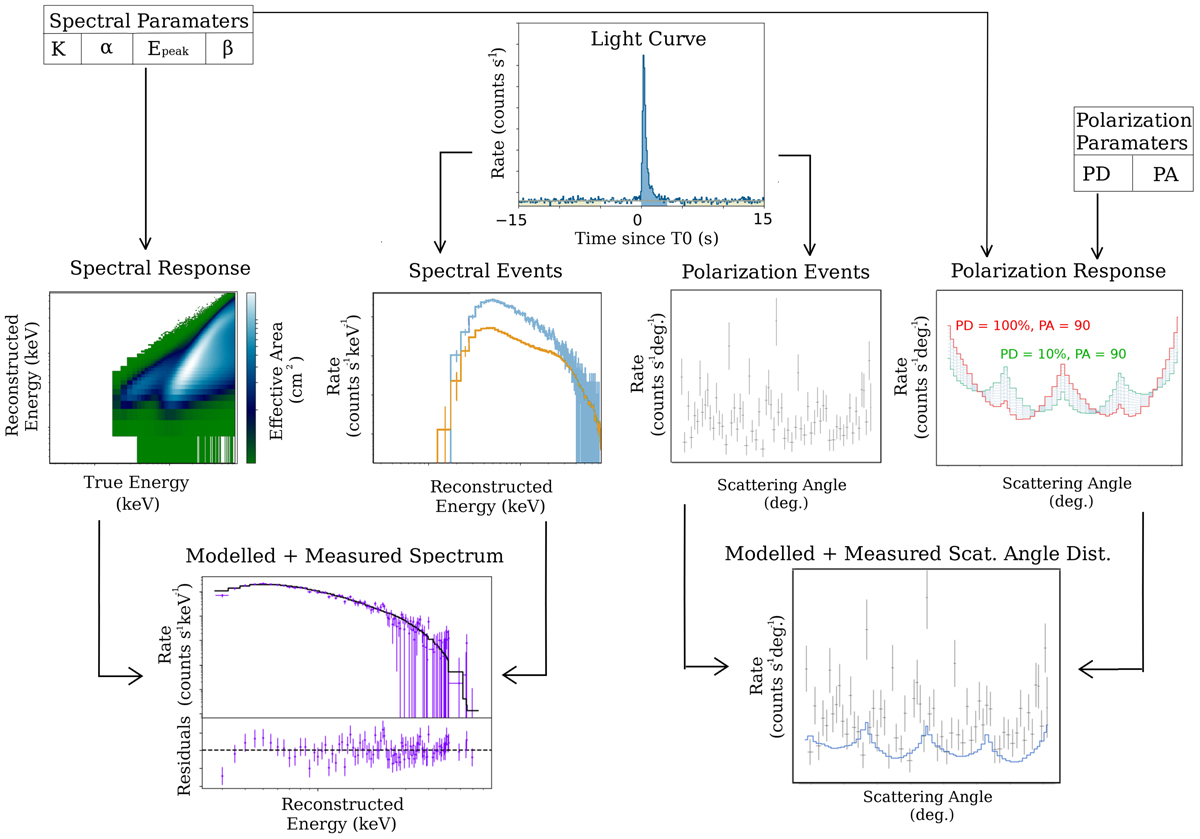
Schematic representation of the analysis method used here. In step one, both the spectral and polarization events are extracted from the data. These are used to produce a spectrum (in count space) and a scattering angle distribution. Spectral parameters are picked from the provided priors and combined with the spectral response to produce a spectrum (again in count space) which is used together with the measured spectrum to calculate a likelihood. In parallel, these spectral parameters are, together with polarization parameters from a prior, provided to the polarization response in order to produce a scattering angle distribution. This is then used to calculate a likelihood using the measured distribution. Going through this process for different parameters in order to minimize the likelihood, a posterior distribution is produced for both the spectral and polarization parameters.
Current usage metrics show cumulative count of Article Views (full-text article views including HTML views, PDF and ePub downloads, according to the available data) and Abstracts Views on Vision4Press platform.
Data correspond to usage on the plateform after 2015. The current usage metrics is available 48-96 hours after online publication and is updated daily on week days.
Initial download of the metrics may take a while.