Open Access
Fig. 5.
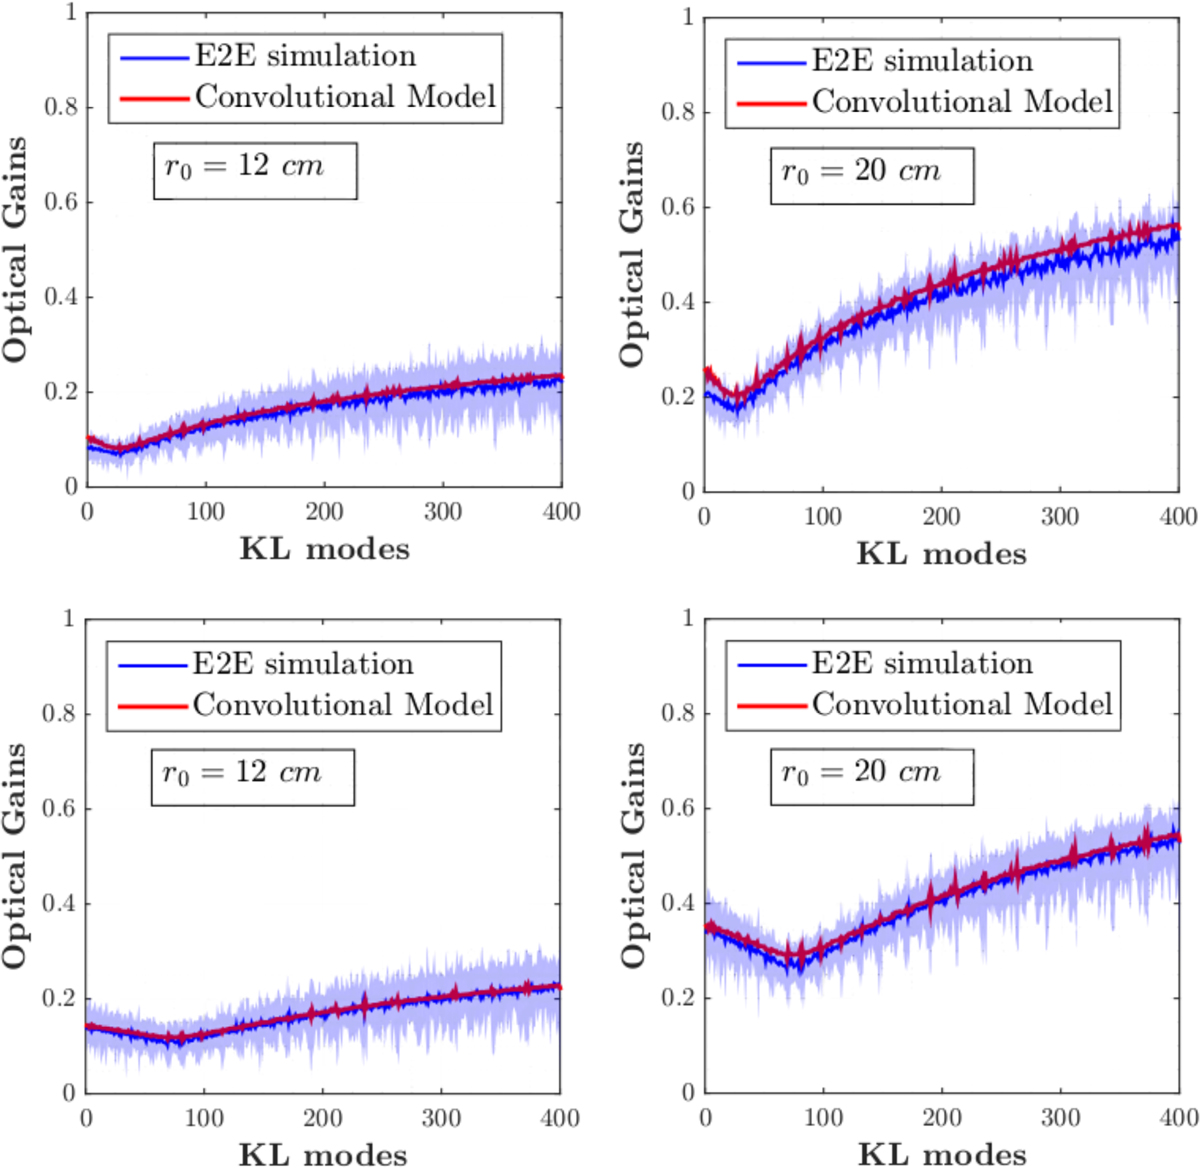
Computed OG on full turbulence screens for multiple r0. The convolutional model fits well with the OG computed by E2E simulations. The shaded area represents the maximum and minimum values found for the OG for 20 phase realisations. Top: rmod = 3λ/D. Bottom: rmod = 5λ/D.
Current usage metrics show cumulative count of Article Views (full-text article views including HTML views, PDF and ePub downloads, according to the available data) and Abstracts Views on Vision4Press platform.
Data correspond to usage on the plateform after 2015. The current usage metrics is available 48-96 hours after online publication and is updated daily on week days.
Initial download of the metrics may take a while.