Fig. 3.
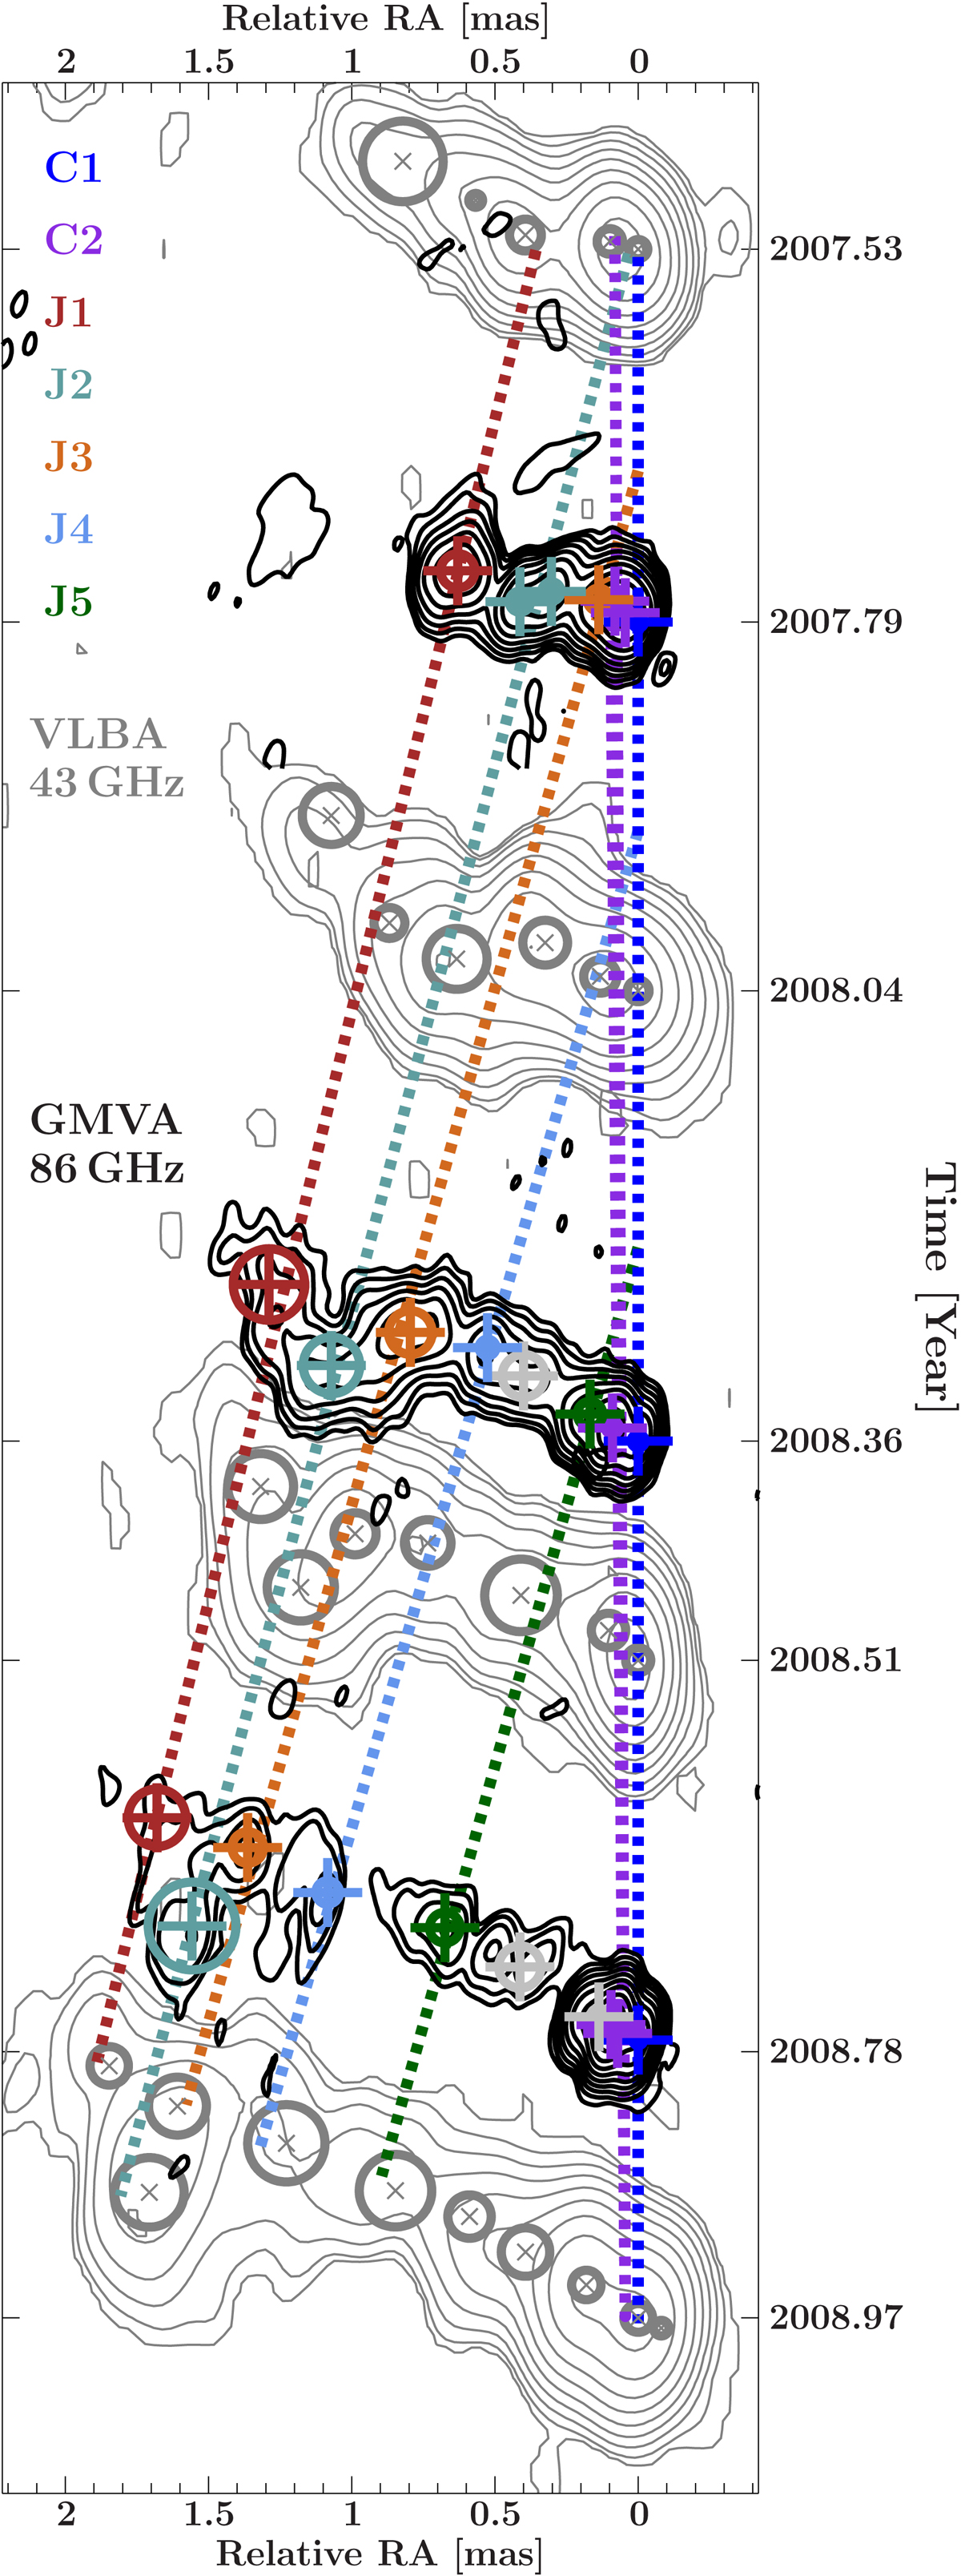
Time-evolution plot of the source morphology at mm wavelengths. The black solid contour lines are based on the CLEAN-images at 86 GHz (GMVA) after restoring with a common beam (0.167 mas × 0.067 mas, −18.2°) and contour lines starting at three times the noise level. Gaussian model components are superimposed on top of the CLEAN-images. The images and components are aligned to the position of C1. The gray dashed contour lines show 43 GHz images from the Boston-University blazar group monitoring programme aligned to the position of the core based on model fitting. The colored, dashed lines were calculated from the kinematic fit to the GMVA components and extrapolated to the first and last 43 GHz observation shown here.
Current usage metrics show cumulative count of Article Views (full-text article views including HTML views, PDF and ePub downloads, according to the available data) and Abstracts Views on Vision4Press platform.
Data correspond to usage on the plateform after 2015. The current usage metrics is available 48-96 hours after online publication and is updated daily on week days.
Initial download of the metrics may take a while.