Fig. 2.
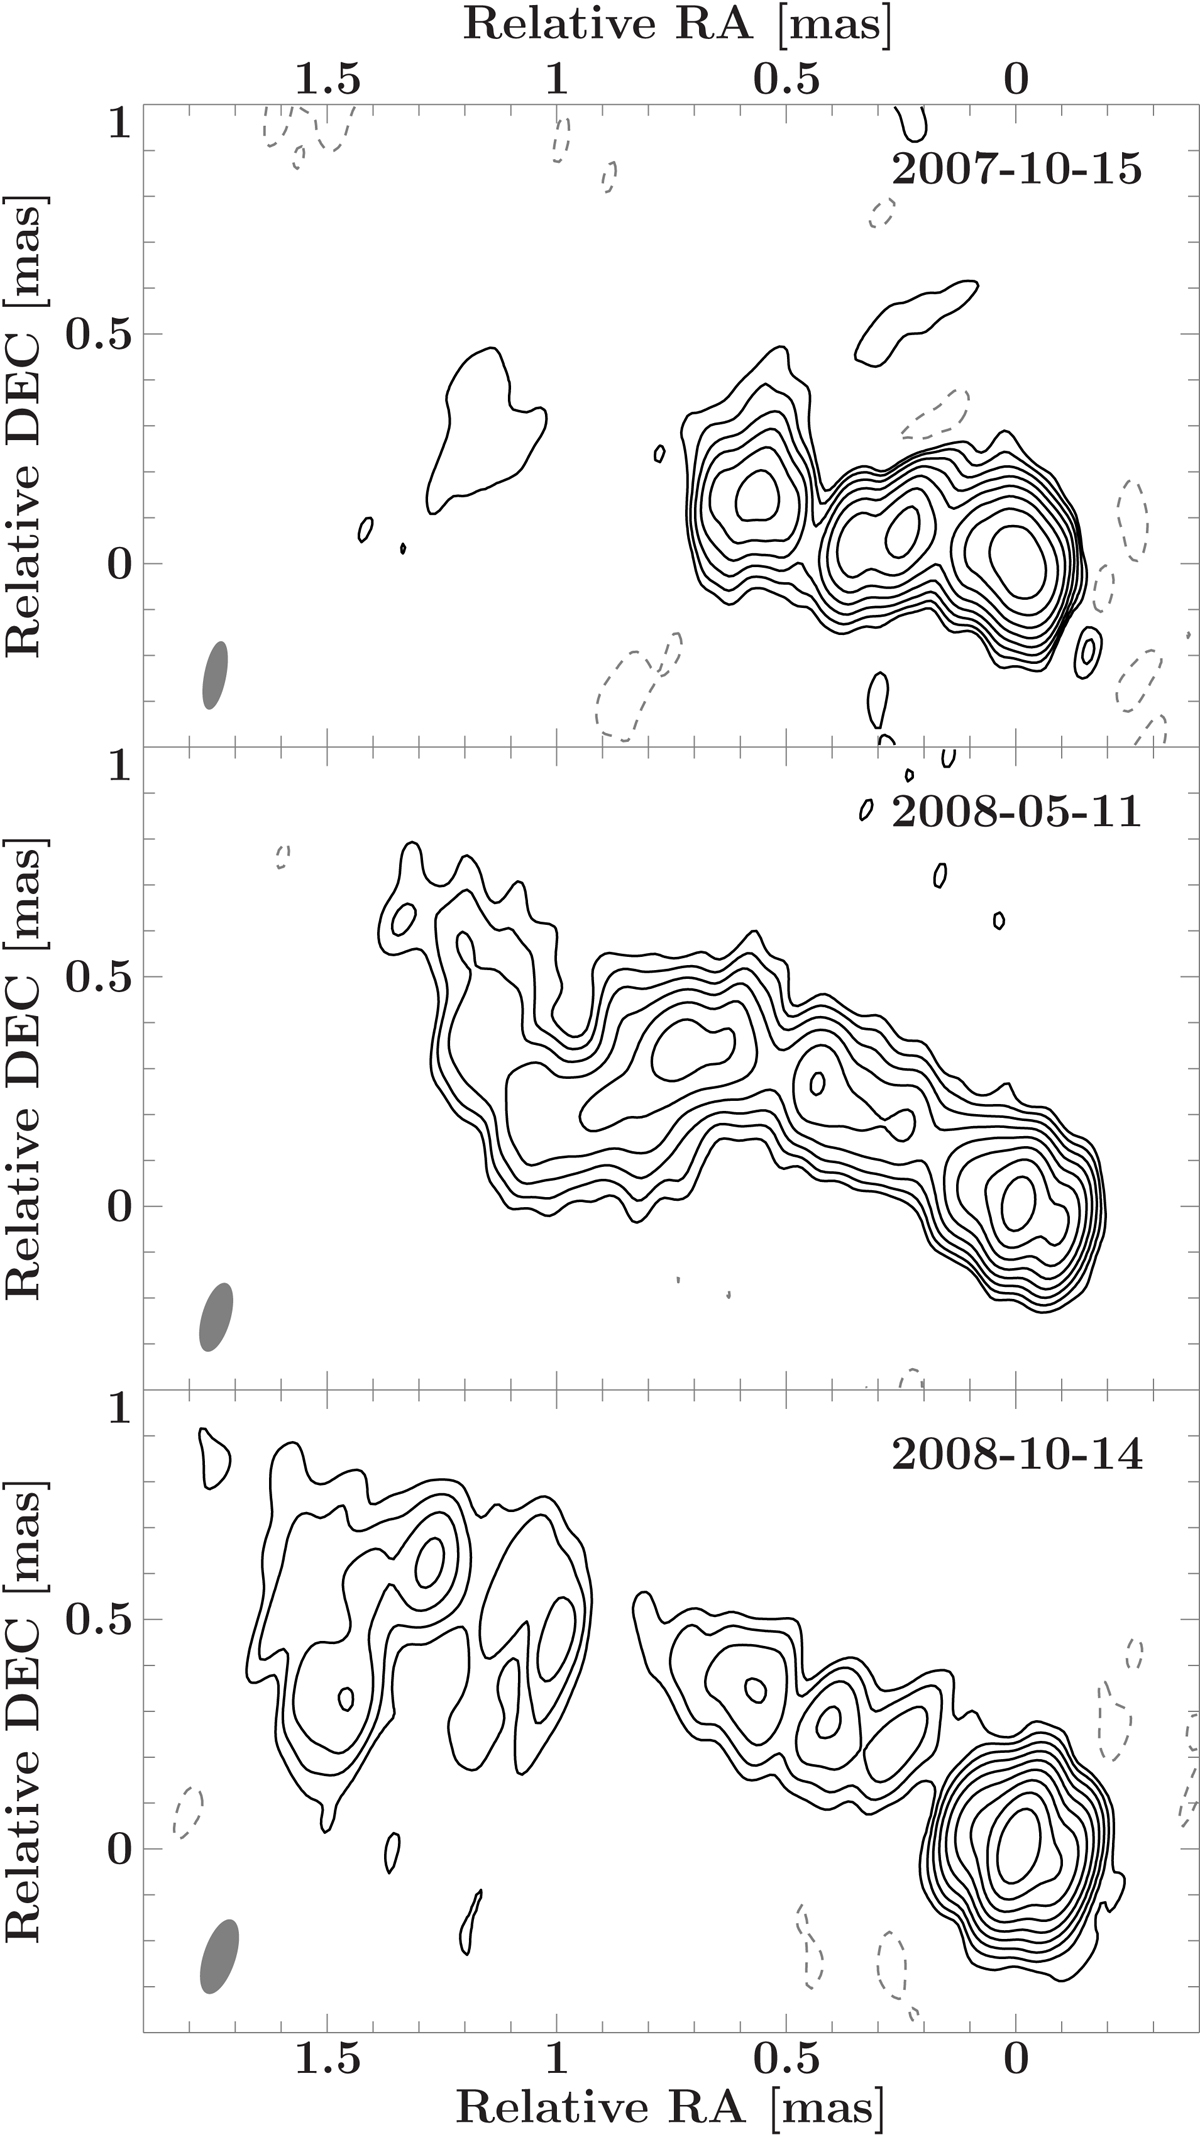
Images from the three GMVA observations of 3C 111 (image parameters given in Table 1). Contour lines start at three times the individual 1σ noise level and increase logarithmically by factors of two. Negative fluctuations at the −3σ level are indicated by dashed, gray contour lines. The gray shaded ellipse in the lower left corner represents the synthesized beam.
Current usage metrics show cumulative count of Article Views (full-text article views including HTML views, PDF and ePub downloads, according to the available data) and Abstracts Views on Vision4Press platform.
Data correspond to usage on the plateform after 2015. The current usage metrics is available 48-96 hours after online publication and is updated daily on week days.
Initial download of the metrics may take a while.