Fig. 1.
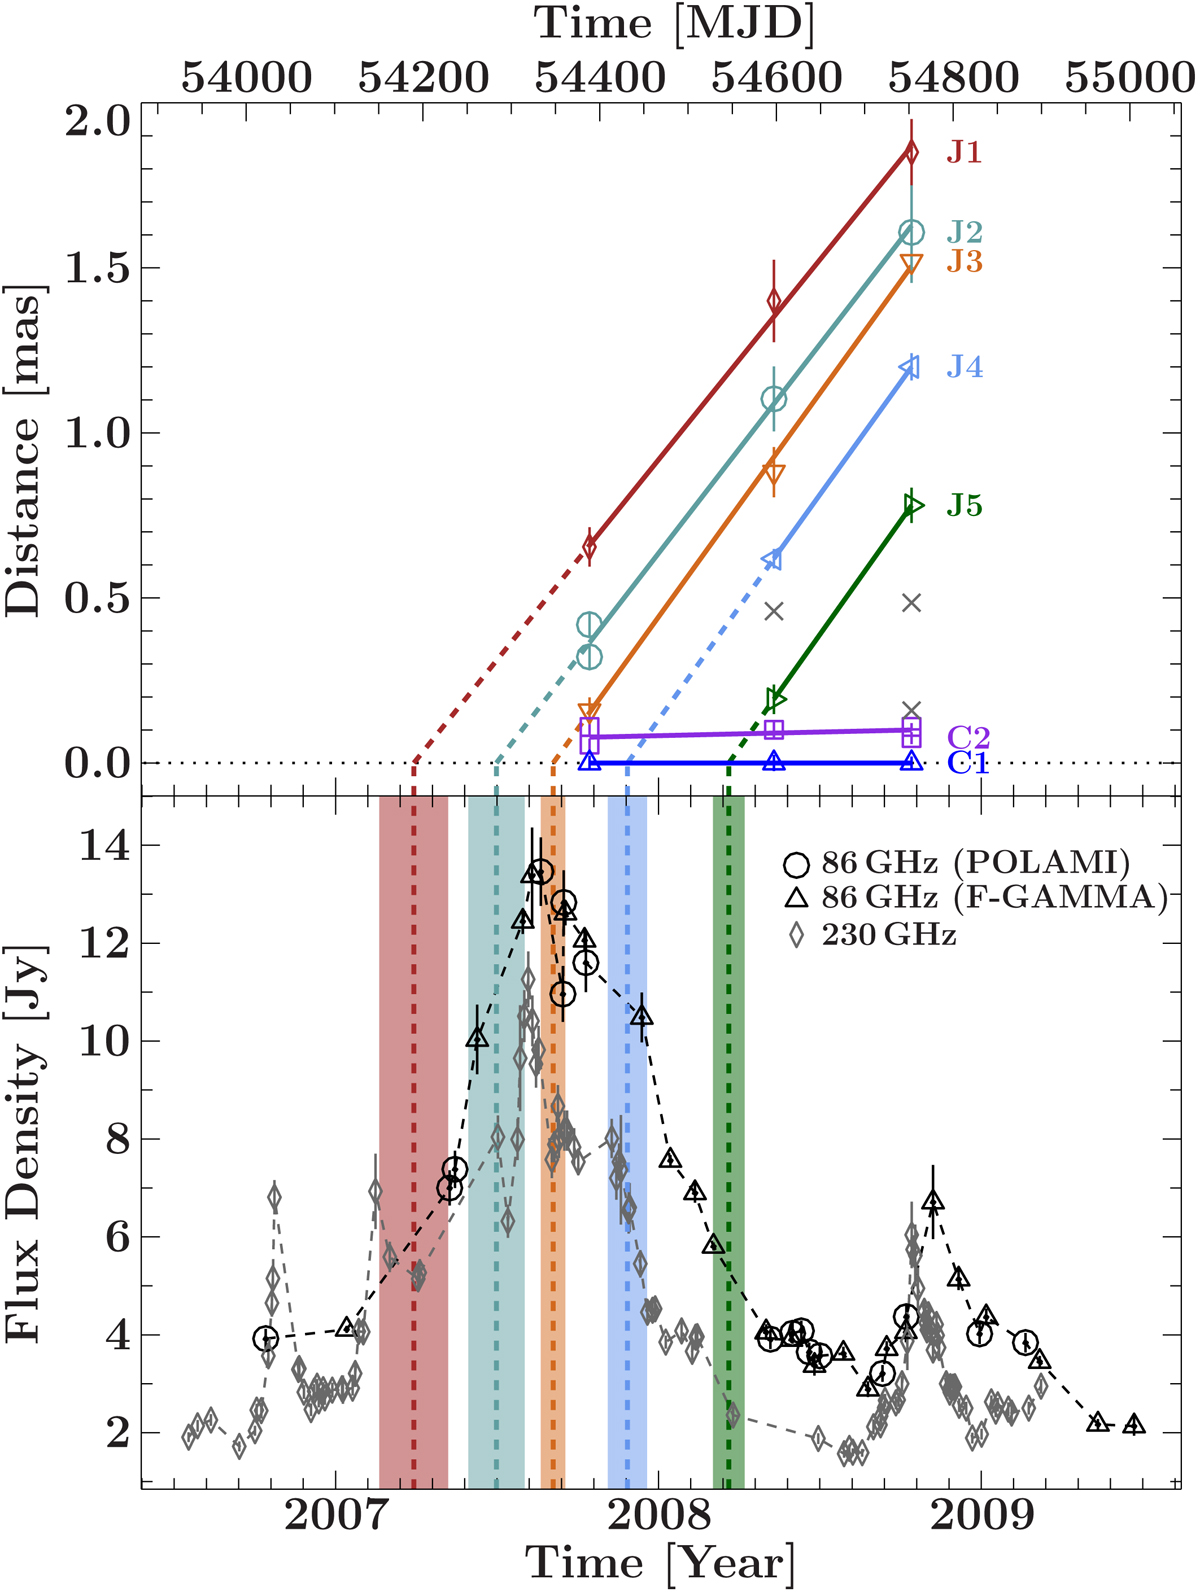
Upper panel: distance of jet features to the central region over time. Highlighted in color are the associated components and in gray unassociated modelfit components. The solid lines were calculated from the vector fit of the apparent transverse velocity. The colored dashed lines represent extrapolations to the estimated ejection times in the distance-time-domain. Bottom panel: radio light curve at 86 GHz (F-GAMMA, POLAMI) and 230 GHz (Chatterjee et al. 2011) between 01 July 2006 and 01 July 2009. The ejection times of the components are highlighted as vertical, colored, dashed lines in both panels. The wide colored bands indicate the uncertainty in the ejection time of the components.
Current usage metrics show cumulative count of Article Views (full-text article views including HTML views, PDF and ePub downloads, according to the available data) and Abstracts Views on Vision4Press platform.
Data correspond to usage on the plateform after 2015. The current usage metrics is available 48-96 hours after online publication and is updated daily on week days.
Initial download of the metrics may take a while.