Fig. 9.
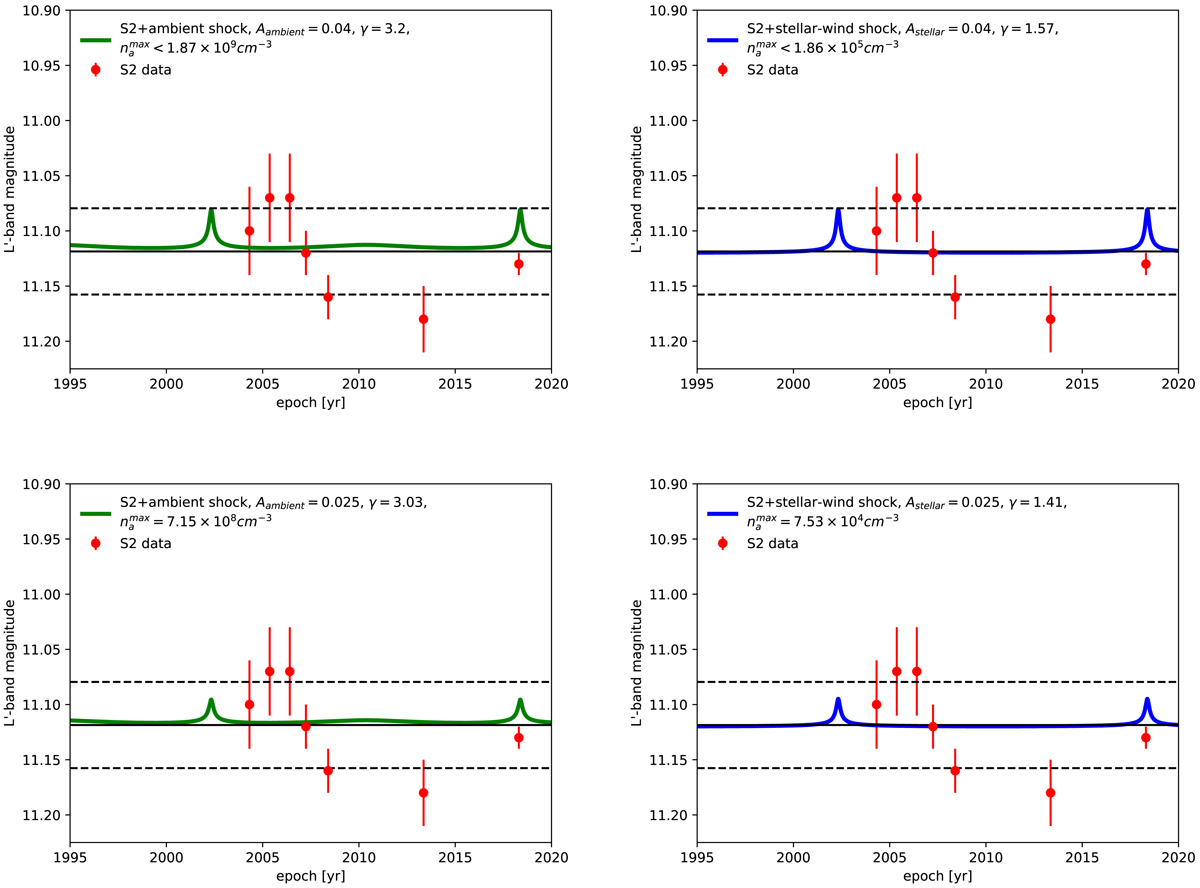
Comparison of model light curves based on the mean S2 emission and the modelled thermal emission of its bow shock (solid green and blue lines) with the observed L′-band emission of S2 (red points with errorbars). Upper panels: modelled thermal emission of the bow shock is associated with the extinction of A = 0.04 mag, which was inferred from the standard deviation of observed light curve points. We model the thermal dust emission of the ambient bow shock (solid green line in left panel) and the thermal emission of the stellar-wind shock (solid blue line in right panel) separately. The horizontal solid black line represents the light curve mean value, while the dashed black lines stand for the standard deviation. Lower panels: as in the upper panels, but for the extinction of A = 0.02 mag based on the excess variance of the observed light-curve points.
Current usage metrics show cumulative count of Article Views (full-text article views including HTML views, PDF and ePub downloads, according to the available data) and Abstracts Views on Vision4Press platform.
Data correspond to usage on the plateform after 2015. The current usage metrics is available 48-96 hours after online publication and is updated daily on week days.
Initial download of the metrics may take a while.