Fig. 11.
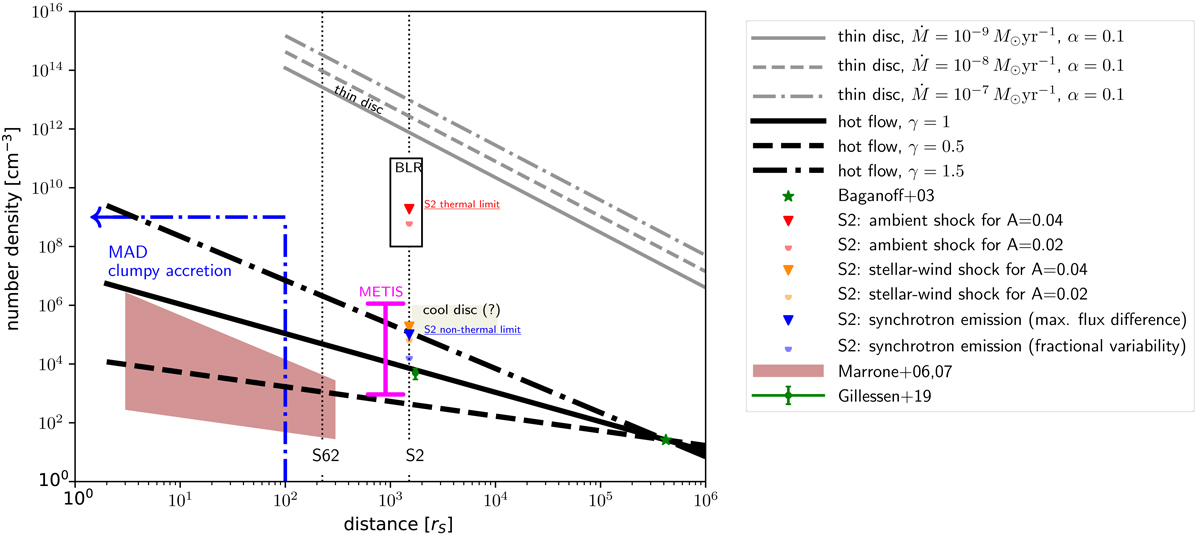
Comparison of the upper density limits that are marked as downward arrows inferred from the L′-band light curve of the S2 star based on modelling ambient and stellar-wind shocks for the dust-extinction values of 0.04 and 0.02 mag with different density profiles and structures according to the plot legend and the description. Alongside the density limit based on the thermal bow-shock emission, we also depict the limit based on the non-thermal bow-shock emission (bluish downward arrows). For comparison, we show the density limit of 26 cm−3 inferred by Baganoff et al. (2003) based on the analysis of the X-ray thermal bremsstrahlung profile. Then we show the density constraint of (5 ± 3) × 103 cm−3 inferred from the potential hydrodynamic drag acting on the DSO/G2 object (Gillessen et al. 2019). The general density power-law profiles are depicted by black lines: the solid line stands for the slope of 1.0, the dashed line represents the flat profile of γ = 0.5, and the dot-dashed line depicts the steeper Bondi-like spherical flow with γ = 1.5. The shaded rectangle shows the distance and the density limits (n ∼ 105 − 106 cm−3) of the putative cool disc whose discovery is claimed by Murchikova et al. (2019). The black-framed rectangle depicts the typical densities of the broad-line region (BLR) clouds in the range of n ∼ 108 − 1011 cm−3. The gray lines depict the number density values expected for a thin disc (Shakura & Sunyaev 1973) for the accretion rate of Ṁ = 10−9 − 10−7 M⊙ yr−1 and the viscosity parameter of α = 0.1. The brown-shaded area to the lower left shows the set of density profiles determined using the rotation measure of the submillimeter polarisation measurements (Marrone et al. 2006, 2007) for the inner radii of rin = 300 rs and rin = 3 rs, density slopes of γ = 0.5−1.5, and the accretion rates in the range 2 × 10⁻⁹ − 2 × 10⁻⁷ M⊙ yr−1. The blue dot-dashed vertical at 100 rs and the blue dot-dashed arrow to the left denote the region of a potential magnetically arrested flow (MAD), where the accretion flow changes from continuous to clumpy due to the accumulated poloidal magnetic flux (see e.g. Narayan et al. 2003; Tursunov et al. 2020). The dotted vertical lines mark the periapsis of the S62 star at ∼225 rs and the periapsis of the S2 star at ∼1512 rs. Next to the S2 pericentre vertical line, we highlight the range of densities potentially being explored using L′-band METIS at ELT imaging mode.
Current usage metrics show cumulative count of Article Views (full-text article views including HTML views, PDF and ePub downloads, according to the available data) and Abstracts Views on Vision4Press platform.
Data correspond to usage on the plateform after 2015. The current usage metrics is available 48-96 hours after online publication and is updated daily on week days.
Initial download of the metrics may take a while.