Fig. 10.
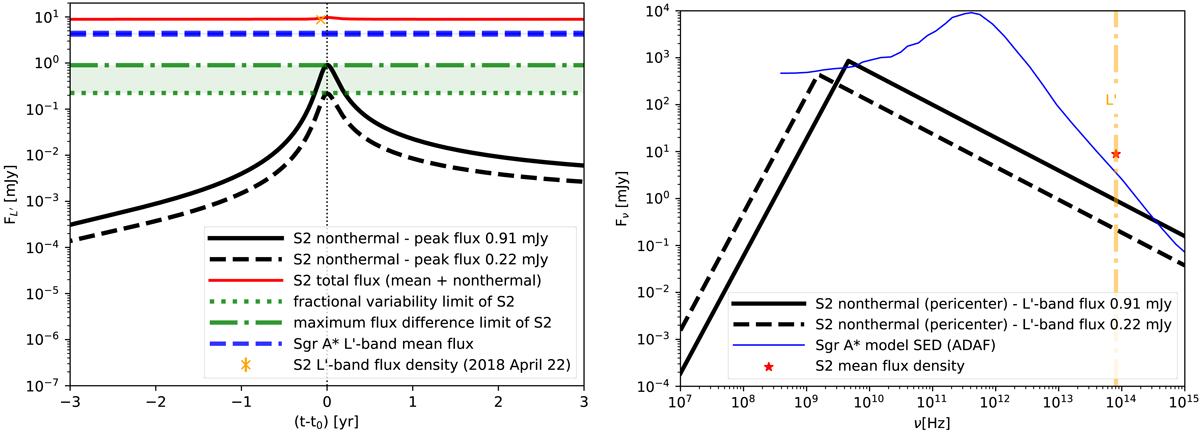
Non-thermal contribution of the S2 bow shock to its L′-band emission. In the left panel, we plot the L′-band light curve as calculated for the S2 bow-shock synchrotron emission for the peak flux of 0.91 mJy (solid black line) and for the peak flux of 0.22 mJy (dashed black line). For comparison, we also show the fractional variability of S2 (dotted green line) and its maximum flux difference (dot-dashed line). The measured mean flux of Sgr A* in L′-band, 4.33 ± 0.18 mJy, is depicted by a dashed blue line. The sum of the mean flux density of S2 with the maximum potential contribution of the non-thermal bow-shock emission is represented by a solid red line. The measured flux density of S2 from 2018.307 is marked by an orange cross. In the right panel, we show the SED of S2 bow-shock synchrotron emission as calculated for the S2 pericentre for the L′-band flux of 0.91 mJy (solid line) and for the L′-band flux of 0.22 mJy (dashed line). The orange dot-dashed line marks the L′-band frequency range and the red star symbol represents the mean flux density of S2 in L′-band. The blue solid line represents the SED of Sgr A* based on the advection dominated accretion flows (ADAFs; Yuan et al. 2003; Yuan & Narayan 2014).
Current usage metrics show cumulative count of Article Views (full-text article views including HTML views, PDF and ePub downloads, according to the available data) and Abstracts Views on Vision4Press platform.
Data correspond to usage on the plateform after 2015. The current usage metrics is available 48-96 hours after online publication and is updated daily on week days.
Initial download of the metrics may take a while.