Fig. 6.
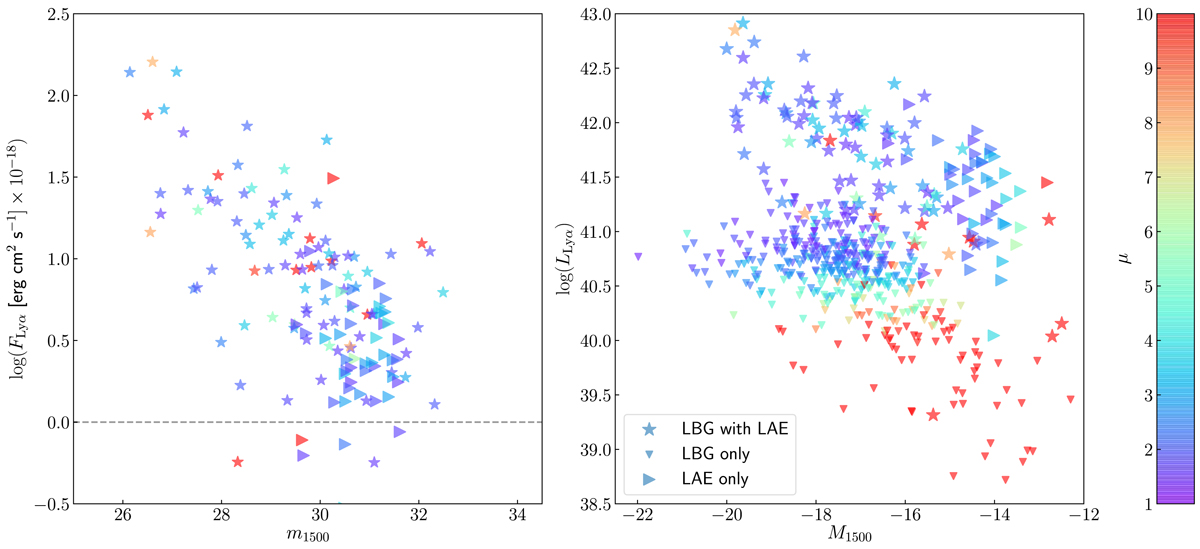
Distribution of the different populations of SFG in their observed and derived properties, showing the magnification μ affecting each galaxy in a color-coded value (see color scale on the right). Left panel: observed Lyα flux versus apparent magnitude m1500, without any correction for magnification, for Samples 1 and 3. The m1500 value was recomputed based on the SED of each galaxy in Sample 1; for Sample 3, it is the limiting magnitude for each source as described in Sect. 4. The limiting Lyα flux assigned to all galaxies in Sample 2 is shown by a gray dashed line. Right panel: Lyman α luminosity versus absolute UV magnitude M1500 after correction for magnification μ. No correction for dust extinction was applied. The effect of magnification in spreading the distribution of galaxies towards the faintest values is clearly seen in this figure.
Current usage metrics show cumulative count of Article Views (full-text article views including HTML views, PDF and ePub downloads, according to the available data) and Abstracts Views on Vision4Press platform.
Data correspond to usage on the plateform after 2015. The current usage metrics is available 48-96 hours after online publication and is updated daily on week days.
Initial download of the metrics may take a while.