Open Access
Fig. 3.
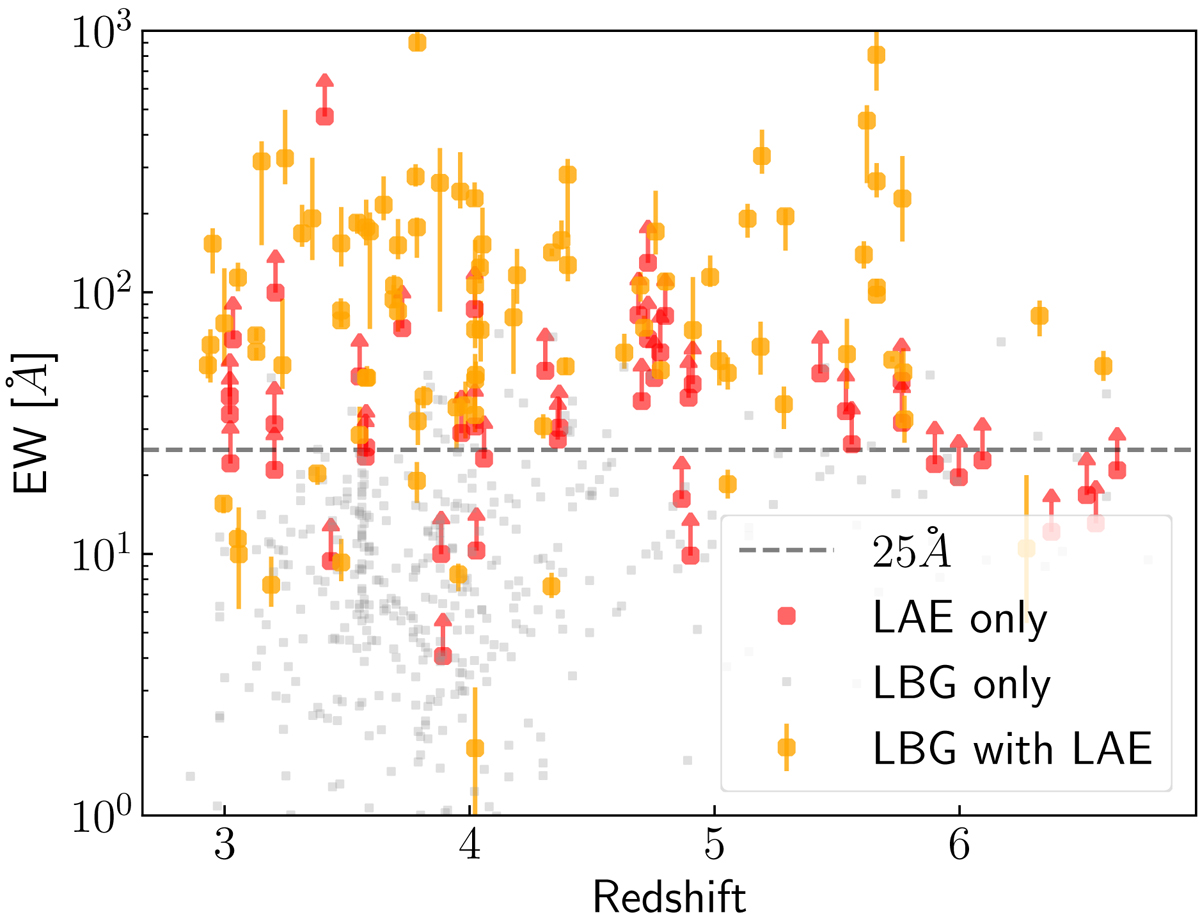
Redshift distribution of the rest-frame EW for Lyα emission in the three samples. For the LBGs without an LAE counterpart in gray, the values are upper limits and the error bars have been omitted for clarity. The dashed horizontal line corresponds to EWLyα = 25 Å.
Current usage metrics show cumulative count of Article Views (full-text article views including HTML views, PDF and ePub downloads, according to the available data) and Abstracts Views on Vision4Press platform.
Data correspond to usage on the plateform after 2015. The current usage metrics is available 48-96 hours after online publication and is updated daily on week days.
Initial download of the metrics may take a while.