Fig. 3.
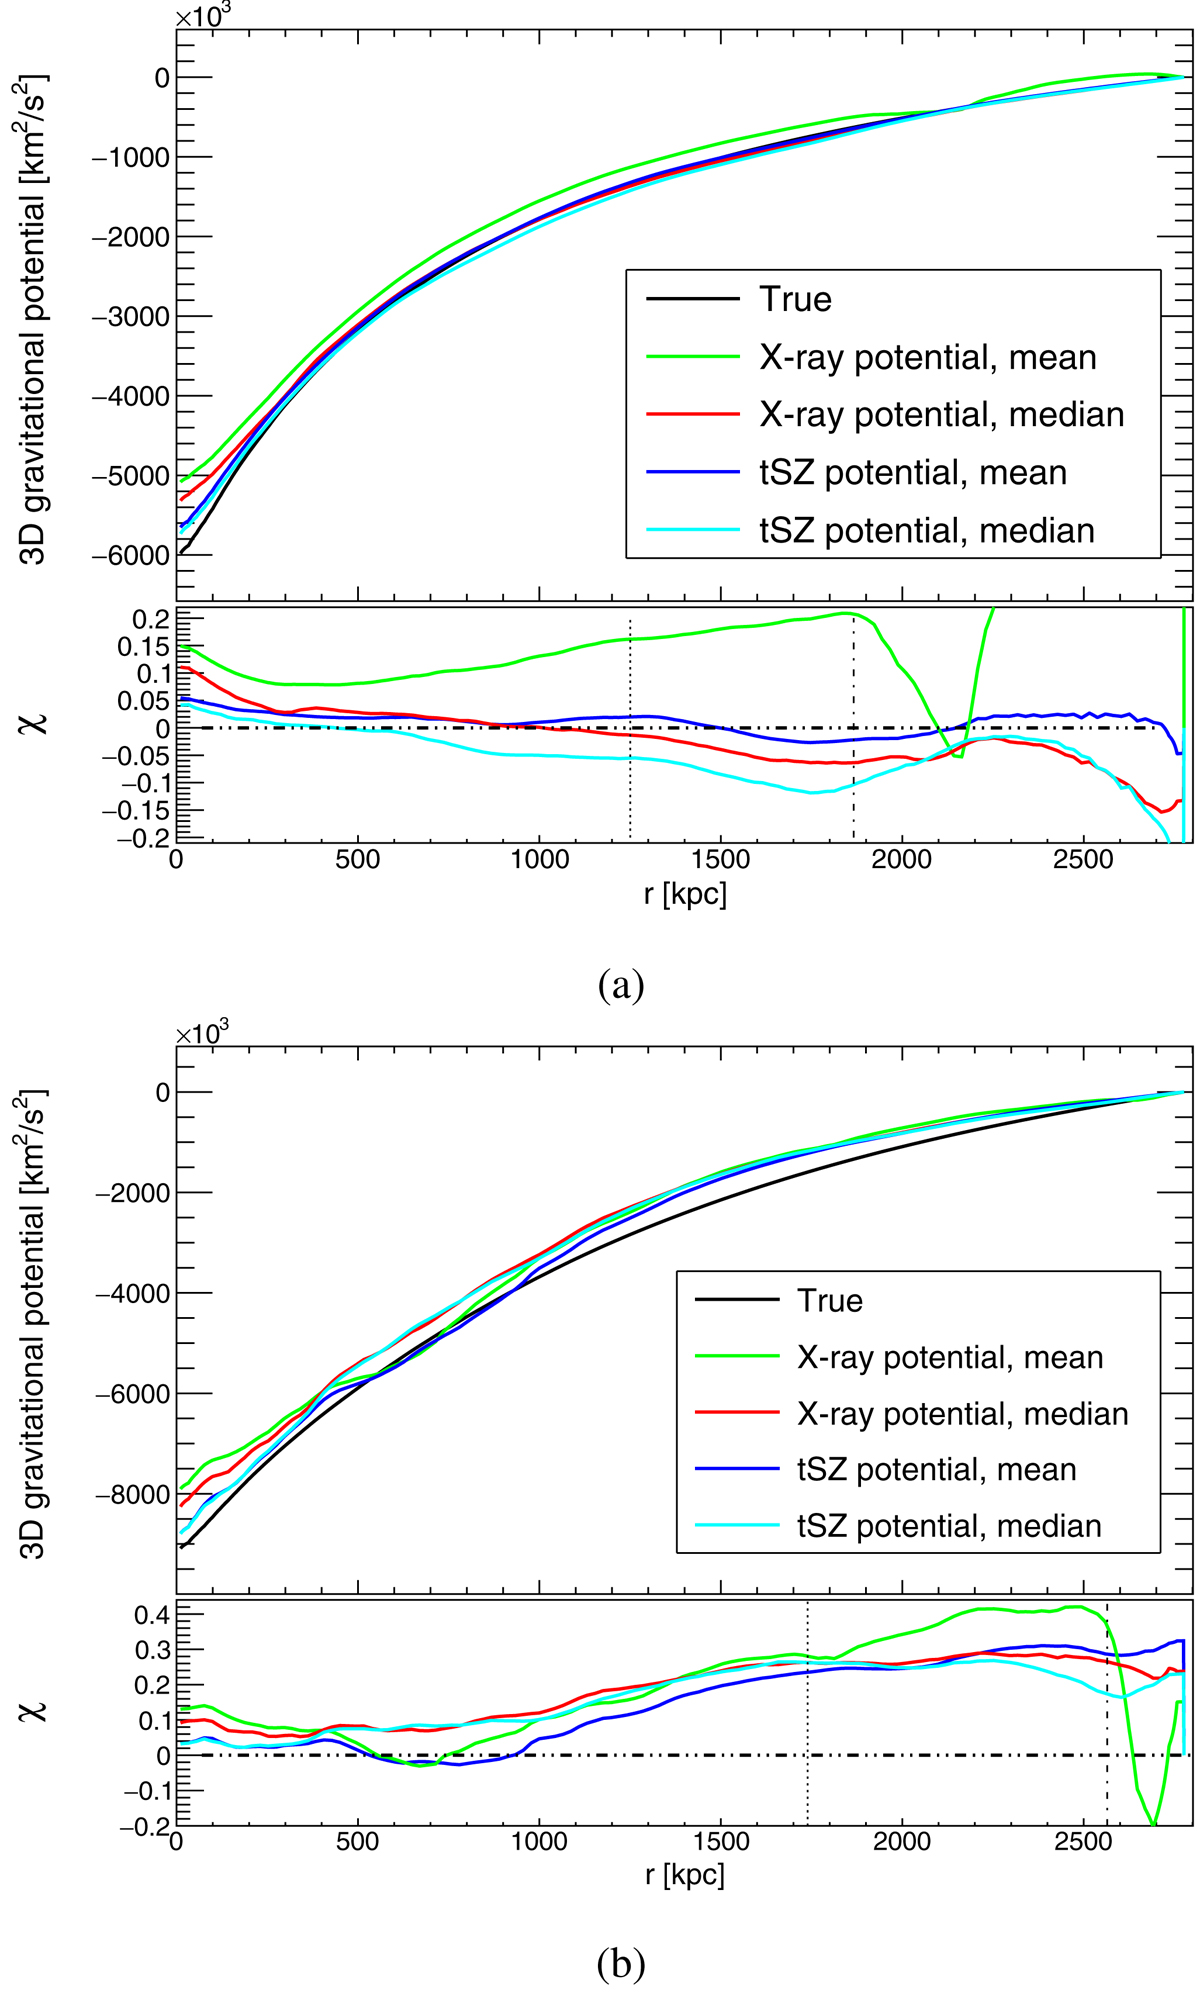
Reconstructed 3D gravitational potential profiles obtained as outlined in Sect. 3.2 assuming spherical symmetry. Top panel: true potential (black curve); X-ray potential (using Eq. (5)) mean (green) and median (red); tSZ potential (using Eq. (6)) mean (blue) and median (cyan). Bottom panel: corresponding relative residuals. The vertical lines represent R500 and R200: (a) for the relaxed cluster CL135; (b) for the merging cluster CL77.
Current usage metrics show cumulative count of Article Views (full-text article views including HTML views, PDF and ePub downloads, according to the available data) and Abstracts Views on Vision4Press platform.
Data correspond to usage on the plateform after 2015. The current usage metrics is available 48-96 hours after online publication and is updated daily on week days.
Initial download of the metrics may take a while.